
COMPLETE SETUP & CONFIGURATION MANUAL
PREREQUISITES & INITIAL SETUP
Before beginning, ensure you have:
- A TradingView account (minimum Essential, preferably Plus+)
- Active Blockcircle subscription
Account Integration Process
- TradingView Account Creation -> Navigate to TradingView.com and create your account. Choose a username carefully as this will be permanent and case-sensitive. Write down your exact username, including any numbers, underscores, or capital letters. For example, if you register as “Blockcircle_Trader1234”, this exact format must be used everywhere.
- Blockcircle Integration Visit blockcircle.com/account and enter your TradingView username exactly as registered. The system performs case-sensitive matching – “Blockcircle_Trader1234” will not match “blockcircle_trader1234”. After entering your username, you’ll receive access to the MMS.
- Accessing Your Trading Chart -> Once logged into TradingView, click “Chart” in the top navigation menu. You’ll see a default chart appear. To change the trading pair, click the symbol in the top-left corner (usually showing “AAPL” or another default). Type your desired pair such as “BTCUSDT” and select the appropriate exchange (BINANCE, COINBASE, KRAKEN, etc.). The exchange choice matters as prices can vary slightly between exchanges and each trading pair represents a unique order book!
- Timeframe Selection Above the chart, you’ll see timeframe options (1m, 5m, 15m, 1h, 4h, D, W, M), depending on what trading strategy you are setting up, you might need to setup a custom time interval by clicking Custom at the bottom. Your timeframe selection fundamentally changes your strategy:
- 1-15 minutes: Day trading and scalping
- 1-4 hours: Swing trading
- Daily/Weekly: Position trading
- Monthly: Long-term investment analysis
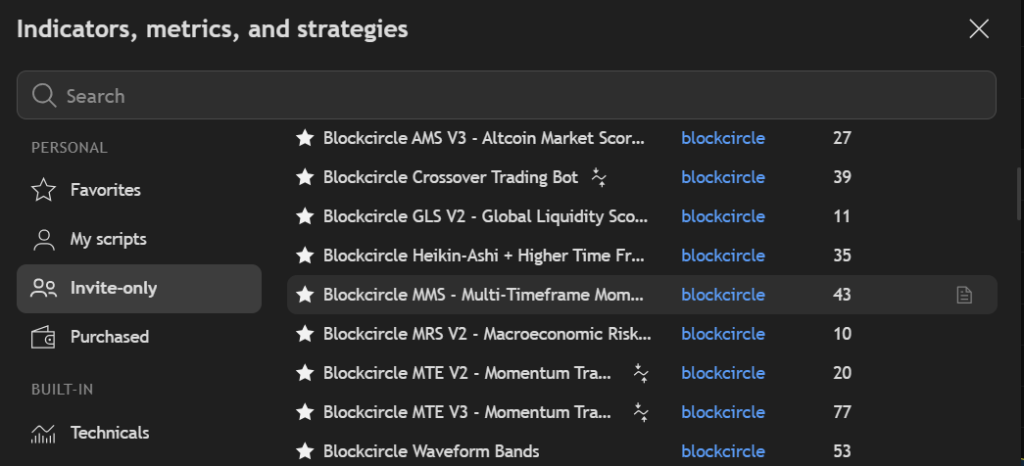
- Adding MMS to Your Chart Click the “Indicators” button (looks like ƒx) at the top of your chart. In the search window that appears, navigate to the “Invite-Only” tab. You should see “Blockcircle MMS – Multi-timeframe Momentum Scorecard” if your account has been granted access. Click on it once to add it to your chart.
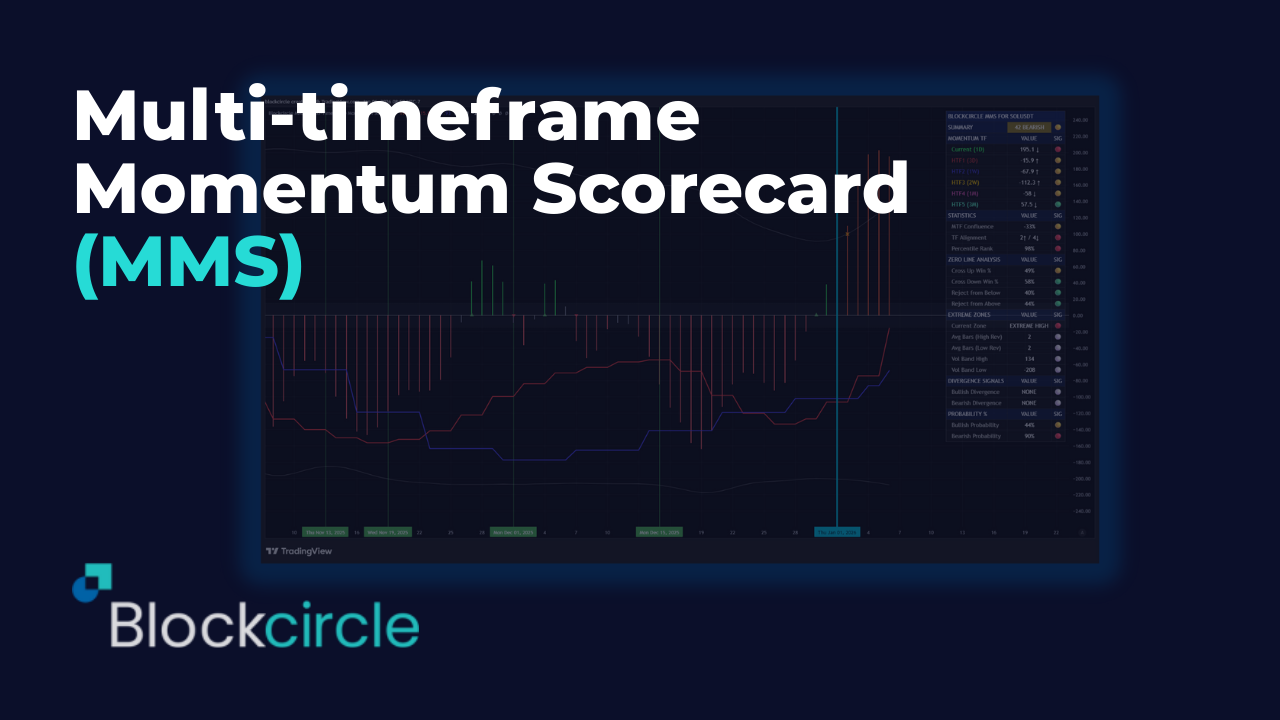
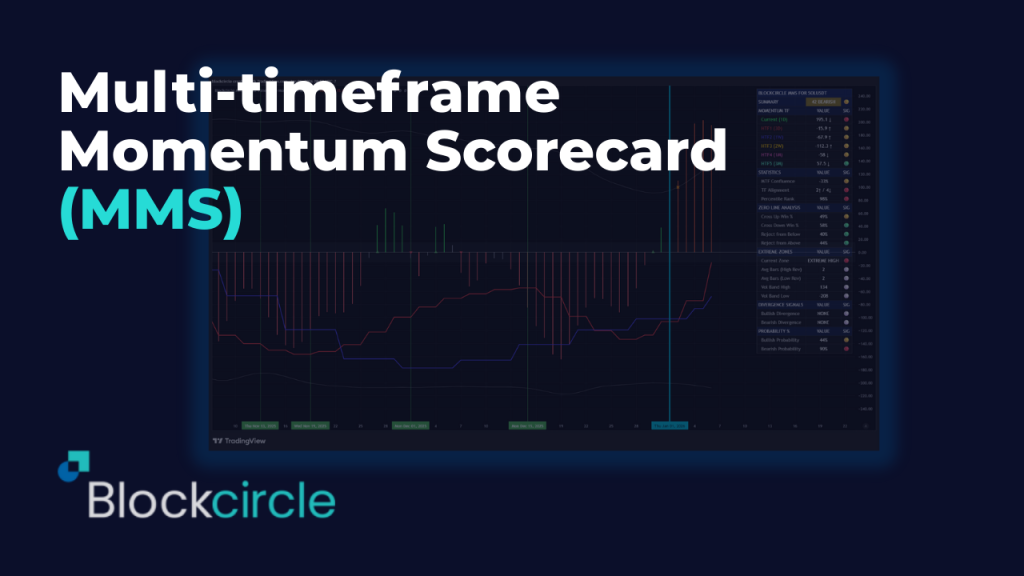
The Blockcircle Multi-timeframe Momentum Scorecard (MMS) is an advanced momentum analysis system that combines the smoothed momentum algorithm with multi-timeframe confluence analysis, statistical probability modeling, and multi-indicator divergence confirmation.
We designed it for serious traders who demand quantitative rigor and actionable intelligence.
Professional Traffic Light System
- 🟢 Green = Favorable/Bullish conditions
- 🟡 Yellow = Neutral/Caution warranted
- 🔴 Red = Unfavorable/Bearish conditions
- Instant visual assessment across all metrics
KEY FEATURES
- T3-smoothed CCI momentum calculation (reduced noise, faster signals)
- Auto-calculated higher timeframes (no manual configuration needed)
- Volatility-adaptive extreme zone bands
- Zero-line cross win rate tracking
- Multi-indicator divergence confirmation system
- Weighted multi-timeframe confluence score
- Percentile rank analysis
- Average bars to reversal statistics
- Probability-based bias assessment
- Comprehensive summary score with status
- Full alert system for all key signals
- Compact table mode for smaller screens
BUILT-IN ALERTS
- Zero Line Cross Up/Down
- Entered Extreme High/Low Zone
- Bullish/Bearish Divergence Confirmed
- Strong Bullish/Bearish Confluence (>80%)
- Strong Trend Signal (Summary Score ≥80)
FULLY CONFIGURABLE
- Every aspect of this indicator can be customized:
- Momentum parameters (CCI Period, T3 Period, Smoothing Factor)
- Volatility band settings (lookback, multiplier, fixed thresholds)
- Zero zone width
- Statistical lookback periods
- Divergence indicator selection
- Higher timeframe auto/manual mode
- All plot colors
- Table position and size
- Display toggles for all features
HOW TO USE
- Identifying high-probability trend continuation entries
- Spotting potential reversals with multi-indicator divergence
- Confirming trade setups with multi-timeframe alignment
- Timing entries using zero-line cross win rates
- Managing risk with extreme zone awareness
- Building systematic trading rules with quantitative data
- Check the Summary Score – Quick health check of momentum across timeframes
- Review MTF Confluence – Are timeframes aligned or conflicting?
- Monitor Zero-Line – Use win rates to time entries on crosses
- Watch for Divergences – Confirmed divergences signal potential reversals
- Respect Extreme Zones – Use “Avg Bars to Reversal” for timing exits
Configure for Your Trading Style
| Trading Style | Recommended Settings |
| Scalping (1-5m charts) | Shorter stat lookback (100), enable all HTFs |
| Day Trading (15m-1H) | Default settings work well |
| Swing Trading (4H-D) | Longer stat lookback (300), focus on HTF3-5 |
| Position Trading (D-W) | Maximum stat lookback (500), disable lower HTFs |
Understanding the Dashboard
The MMS dashboard is organized into logical sections, each providing specific intelligence about momentum conditions.
Dashboard Layout
Copy
┌─────────────────────────────────────────────┐
│ BLOCKCIRCLE MOMENTUM │
├─────────────────────────────────────────────┤
│ SUMMARY │ 72/100 │ BULLISH │ HEALTHY │ 🟢 │
├─────────────────────────────────────────────┤
│ MOMENTUM BY TIMEFRAME │
├─────────────────────────────────────────────┤
│ Current (15m) │ 45.2 │ ↑ │ BULLISH │ 🟢 │
│ HTF1 (30m) │ 38.7 │ ↑ │ BULLISH │ 🟢 │
│ HTF2 (1H) │ 52.1 │ ↓ │ BULLISH │ 🟢 │
│ HTF3 (2H) │ 28.4 │ ↑ │ BULLISH │ 🟢 │
├─────────────────────────────────────────────┤
│ STATISTICS │
├─────────────────────────────────────────────┤
│ MTF Confluence │ 67% │ BULLISH │ 🟢 │
│ TF Alignment │ 4↑/0↓│ BULL ALIGNED│🟢 │
│ Percentile Rank │ 72% │ NORMAL │ 🟢 │
├─────────────────────────────────────────────┤
│ ZERO LINE ANALYSIS │
├─────────────────────────────────────────────┤
│ Cross Up Win Rate │ 62% │ RELIABLE │ 🟢 │
│ Cross Down Win Rate│ 58% │ RELIABLE │ 🟢 │
│ Reject from Below │ 35% │ NORMAL │ 🟢 │
│ Reject from Above │ 42% │ NORMAL │ 🟢 │
├─────────────────────────────────────────────┤
│ EXTREME ZONES │
├─────────────────────────────────────────────┤
│ Current Zone │ BULLISH ZONE │ 🟢 │
│ Avg Bars (High) │ 12 │ RELIABLE │ ⚪ │
│ Avg Bars (Low) │ 14 │ RELIABLE │ ⚪ │
│ Vol Band High │ 95 │ ⚪ │
│ Vol Band Low │ -92 │ ⚪ │
├─────────────────────────────────────────────┤
│ DIVERGENCE SIGNALS │
├─────────────────────────────────────────────┤
│ Bullish Divergence │ NONE │ ⚪ │
│ Bearish Divergence │ NONE │ ⚪ │
├─────────────────────────────────────────────┤
│ PROBABILITY ASSESSMENT │
├─────────────────────────────────────────────┤
│ Bullish Probability │ 68% │ FAVORED │ 🟢 │
│ Bearish Probability │ 32% │ │ 🟡 │
└─────────────────────────────────────────────┘
Column Definitions
| Column | Description |
| Metric | Name of the measurement |
| VALUE | Current numerical value |
| TREND | Direction indicator (↑ rising, ↓ falling, → flat) |
| STATUS | Categorical assessment of the reading |
| SIG | Traffic light signal for quick reference |
Core Concepts
What is Momentum?
In the context of the MMS, momentum measures the rate of change in price relative to its recent history, smoothed using the T3 algorithm to reduce noise while maintaining responsiveness.
Positive Momentum (>0): Price is generally rising; buyers are in control Negative Momentum (<0): Price is generally falling; sellers are in control Zero Line: The equilibrium point; crosses indicate potential trend changes
The Momentum Foundation
The MMS uses a T3-smoothed Commodity Channel Index (CCI) as its core calculation. This provides several advantages:
- Triple Exponential Smoothing: Reduces whipsaws and false signals
- Normalized Output: Values are comparable across different assets
- Mean-Reverting Properties: Extreme readings tend to revert
- Sensitivity Control: The B parameter allows tuning responsiveness
Traffic Light System
The MMS uses a consistent traffic light system throughout:
| Signal | Meaning | Action Implication |
| 🟢 | Favorable/Bullish | Conditions support the indicated direction |
| 🟡 | Neutral/Caution | Mixed signals; patience recommended |
| 🔴 | Unfavorable/Warning | Conditions oppose or warn of reversal |
| ⚪ | Informational | Data point without directional bias |
Momentum Calculation Methodology
The Momentum Algorithm
The indicator calculates momentum using a sophisticated smoothing algorithm:
Copy
Step 1: Calculate standard CCI
CCI = (Typical Price – SMA) / (0.015 × Mean Deviation)
Step 2: Apply T3 smoothing (6-pass EMA with coefficients)
T3 = c1×e6 + c2×e5 + c3×e4 + c4×e3
Where coefficients are derived from parameter B:
c1 = -B³
c2 = 3(B² + B³)
c3 = -3(2B² + B + B³)
c4 = 1 + 3B + B³ + 3B²
Parameter Influence
| Parameter | Default | Effect of Increasing | Effect of Decreasing |
| CCI Period | 14 | Smoother, slower signals | Faster, noisier signals |
| T3 Period | 5 | More smoothing | Less smoothing |
| B (Smoothing Factor) | 0.618 | More lag, smoother | Less lag, more responsive |
Interpretation Scale
| Momentum Value | Interpretation |
| > +100 | Strong bullish momentum (potentially extreme) |
| +50 to +100 | Healthy bullish momentum |
| +15 to +50 | Moderate bullish momentum |
| -15 to +15 | Neutral zone (no clear direction) |
| -50 to -15 | Moderate bearish momentum |
| -100 to -50 | Healthy bearish momentum |
| < -100 | Strong bearish momentum (potentially extreme) |
Multi-Timeframe Analysis
The Power of Multiple Timeframes
Single-timeframe analysis is inherently limited. A bullish signal on a 15-minute chart means little if the 4-hour and daily charts show strong bearish momentum. The MMS solves this by analyzing up to 6 timeframes simultaneously.
Auto-Calculated Timeframes
When enabled (default), the MMS automatically selects appropriate higher timeframes based on your chart:
| Your Chart | HTF1 | HTF2 | HTF3 | HTF4 | HTF5 |
| 1 minute | 5m | 15m | 1H | 4H | Daily |
| 5 minutes | 15m | 30m | 1H | 4H | Daily |
| 15 minutes | 30m | 1H | 2H | 4H | Daily |
| 30 minutes | 1H | 2H | 4H | Daily | Weekly |
| 1 hour | 2H | 4H | Daily | 3D | Weekly |
| 4 hours | 8H | 12H | Daily | 3D | Weekly |
| Daily | 3D | Weekly | 2W | Monthly | 3M |
| Weekly | 2W | Monthly | 3M | 6M | 12M |
Weighted Confluence Scoring
Not all timeframes are created equal. Higher timeframes carry more weight in determining overall trend direction:
| Timeframe | Weight |
| Current | 1.0x |
| HTF1 | 1.5x |
| HTF2 | 2.0x |
| HTF3 | 2.5x |
| HTF4 | 3.0x |
| HTF5 | 3.5x |
Confluence Score Calculation:
Copy
Score = (Σ Weighted Bias) / (Σ Weights) × 100
Where Bias = +1 (bullish), -1 (bearish), or 0 (neutral)
Interpreting Confluence
| Confluence Score | Interpretation |
| +80% to +100% | Strong bullish alignment – high-confidence bullish |
| +50% to +79% | Bullish bias – majority of timeframes bullish |
| +20% to +49% | Slight bullish lean – mixed but favoring bulls |
| -19% to +19% | Neutral/Conflicting – no clear direction |
| -49% to -20% | Slight bearish lean – mixed but favoring bears |
| -79% to -50% | Bearish bias – majority of timeframes bearish |
| -100% to -80% | Strong bearish alignment – high-confidence bearish |
TF Alignment Display
The “TF Alignment” row shows a quick count:
- 4↑ / 1↓ means 4 timeframes bullish, 1 bearish
- BULL ALIGNED status when bullish TFs > bearish TFs
- BEAR ALIGNED status when bearish TFs > bullish TFs
- MIXED status when counts are equal or close
Volatility-Adjusted Bands
The Problem with Fixed Levels
Traditional oscillators use fixed overbought/oversold levels (e.g., RSI 70/30). This creates problems:
- In strong trends, price can remain “overbought” for extended periods
- In low-volatility environments, price may never reach extreme levels
- Fixed levels ignore the asset’s historical behavior
Dynamic Band Calculation
The MMS calculates dynamic extreme zones using:
Copy
Upper Band = Mean + (Standard Deviation × Multiplier)
Lower Band = Mean – (Standard Deviation × Multiplier)
Where:
– Mean = Simple Moving Average of momentum over lookback period
– Standard Deviation = Volatility measure over same period
– Multiplier = User-configurable (default 2.0)
Benefits of Dynamic Bands
| Scenario | Fixed Bands | Dynamic Bands |
| High volatility market | Too many extreme signals | Bands widen appropriately |
| Low volatility market | Never reaches extremes | Bands tighten to capture moves |
| Trending market | Persistent false signals | Adapts to trending conditions |
| Mean-reverting market | May work adequately | Optimizes for current behavior |
Configuration Options
| Setting | Default | Description |
| Use Volatility Bands | True | Enable/disable dynamic calculation |
| Volatility Lookback | 100 | Bars used for mean/stdev calculation |
| Band Multiplier | 2.0 | How many standard deviations (1.5-3.0 typical) |
| Fixed Extreme High | 100 | Used when volatility bands disabled |
| Fixed Extreme Low | -100 | Used when volatility bands disabled |
Zero-Line Analysis
Significance of the Zero Line
The zero line is the most important level on any momentum oscillator. It represents equilibrium – the point where buying and selling pressure are balanced.
Zero Line Cross Up: Momentum shifting from negative to positive (potential bullish) Zero Line Cross Down: Momentum shifting from positive to negative (potential bearish)
Win Rate Tracking
One of the most powerful features of the MMS is its historical win rate tracking for zero-line crosses.
How It Works:
- When momentum crosses above zero, the indicator records the event
- After 10 bars, it checks if price moved higher (a “win”)
- The win rate is calculated: Wins ÷ Total Crosses × 100
Interpretation:
| Win Rate | Interpretation | Trading Implication |
| > 65% | Highly reliable | Strong signal, consider aggressive positioning |
| 55-65% | Reliable | Good signal, standard position size |
| 45-55% | Neutral | Signal has no statistical edge |
| < 45% | Unreliable | Consider fading or ignoring |
Rejection Probability
Not all approaches to the zero line result in a cross. Sometimes momentum approaches but then reverses, a “rejection.”
Reject from Below: Momentum rose from below but failed to cross above zero Reject from Above: Momentum fell from above but failed to cross below zero
High rejection probability (>60%) suggests:
- Strong resistance at the zero line
- Trend is likely to continue in the original direction
- Wait for confirmed cross rather than anticipating
Zero Zone Configuration
The “Zero Zone Width” parameter (default ±15) defines a neutral area around zero:
- Momentum within this zone is considered “neutral”
- Helps filter noise when momentum is directionless
- Adjustable based on asset volatility
Divergence Detection System
What is Divergence?
Divergence occurs when price and momentum move in opposite directions:
Bullish Divergence: Price makes lower low, but momentum makes higher low
- Interpretation: Selling pressure weakening, potential reversal up
Bearish Divergence: Price makes higher high, but momentum makes lower high
- Interpretation: Buying pressure weakening, potential reversal down
Multi-Indicator Confirmation
The MMS doesn’t rely on momentum divergence alone. It can confirm divergences using multiple indicators:
| Indicator | Default | What It Measures |
| Momentum | Always on | Rate of price change |
| RSI | Enabled | Relative strength of moves |
| MACD | Enabled | Trend momentum via moving average convergence |
| MFI | Disabled | Money flow (volume-weighted RSI) |
| CMF | Disabled | Chaikin Money Flow (accumulation/distribution) |
Confirmation Requirements
The MMS requires at least 2 indicators to confirm a divergence before signaling:
| Confirmations | Signal Strength | Display |
| 1 indicator | Weak (not signaled) | “MOMENTUM ONLY” in dashboard |
| 2 indicators | Moderate | “2 CONFIRMATIONS” + Signal marker |
| 3 indicators | Strong | “3 CONFIRMATIONS” + Signal marker |
| 4 indicators | Very Strong | “4 CONFIRMATIONS” + Signal marker |
Divergence Display
When divergence is detected:
- Dashboard shows confirmation count
- Chart displays labeled marker (if enabled)
- Alert can be triggered (if configured)
Statistics and Probability
Percentile Rank
The percentile rank tells you where the current momentum reading sits relative to historical readings.
Calculation:
Copy
Percentile = (Count of bars where current > historical) / Lookback × 100
Interpretation:
| Percentile | Meaning |
| 90-100% | Momentum is in the top 10% of readings (extreme high) |
| 75-90% | Above average momentum (elevated) |
| 25-75% | Normal range |
| 10-25% | Below average momentum (depressed) |
| 0-10% | Momentum is in the bottom 10% of readings (extreme low) |
Average Bars to Reversal
When momentum enters extreme zones, how long does it typically stay there before reversing?
The MMS tracks this automatically:
- Records when momentum enters extreme high/low zone
- Counts bars until it exits
- Calculates running average
Using This Data:
- If avg bars = 12 and you’ve been in extreme for 15 bars, reversal may be imminent
- If avg bars = 20 and you’ve been in extreme for 5 bars, more room to run
- “RELIABLE” status = 5+ data points; “LOW DATA” = fewer samples
Probability Assessment
The MMS calculates bullish and bearish probabilities based on multiple factors:
Base Probability: 50/50
Adjustments:
| Factor | Bullish Adjustment | Bearish Adjustment |
| Current momentum bullish | +10% | -10% |
| Current momentum bearish | -10% | +10% |
| MTF Confluence | +(confluence × 0.25) | -(confluence × 0.25) |
| Momentum gaining | +8% | — |
| Momentum losing | — | +8% |
| Momentum weakening (bull) | -8% | +12% |
| Momentum weakening (bear) | +12% | -8% |
| Bullish divergence confirmed | +15% | — |
| Bearish divergence confirmed | — | +15% |
| In extreme high zone | — | +15% |
| In extreme low zone | +15% | — |
| Percentile > 90% | — | +(pctl-80) × 0.8 |
| Percentile < 10% | +(20-pctl) × 0.8 | — |
Final probabilities are capped between 5% and 95%
Summary Score Explained
What is the Summary Score?
The Summary Score (0-100) provides a single number representing overall momentum health and trend strength. It’s designed for quick assessment before diving into details.
Score Components
| Component | Weight | What It Measures |
| Confluence Contribution | 0-30 pts | How aligned are timeframes? |
| Trend Strength | 0-25 pts | How many TFs agree on direction? |
| Momentum Health | 0-25 pts | Is momentum gaining, stable, or weakening? |
| Zone Status | 0-20 pts | Is price in a clear trending zone? |
Score Interpretation
| Score | Status | Meaning |
| 80-100 | STRONG TREND | High conviction setup; timeframes aligned; momentum healthy |
| 60-79 | HEALTHY | Good conditions; minor conflicts or weakening |
| 40-59 | NEUTRAL | Mixed signals; no clear edge |
| 20-39 | WEAK | Conflicting timeframes; momentum unclear |
| 0-19 | CONFLICTED | Highly mixed; avoid or wait for clarity |
Bias Determination
The “Bias” field shows directional lean based on confluence:
- BULLISH: Confluence score > +30%
- BEARISH: Confluence score < -30%
- MIXED: Confluence score between -30% and +30%
Configuration Guide
Display Settings
| Setting | Options | Recommendation |
| Show Dashboard | True/False | Keep True unless screen space is limited |
| Table Position | 9 positions | Top-right for most users |
| Text Size | Tiny/Small/Normal/Large | Small or Normal for readability |
| Show Signal Markers | True/False | True for visual traders |
| Show Divergence Markers | True/False | True to see divergences on chart |
| Compact Table Mode | True/False | True for smaller screens |
Momentum Core Settings
| Setting | Default | Range | Notes |
| CCI Period | 14 | 5-30 | Lower = faster, noisier; Higher = slower, smoother |
| T3 Period | 5 | 2-10 | Higher = more smoothing |
| T3 Smoothing Factor (B) | 0.618 | 0-1 | 0.618 (golden ratio) provides good balance |
Volatility Band Settings
| Setting | Default | When to Adjust |
| Use Volatility Bands | True | Disable only if you prefer fixed levels |
| Volatility Lookback | 100 | Increase for longer-term perspective |
| Band Multiplier | 2.0 | Increase (2.5-3.0) for fewer extreme signals |
| Fixed Extreme High/Low | ±100 | Only used when volatility bands disabled |
Timeframe Settings
| Setting | Default | Notes |
| Auto-Calculate Higher TFs | True | Recommended; automatically selects appropriate TFs |
| HTF1-5 Enable | Varies | Disable higher TFs for faster calculation |
| HTF1-5 Manual | Standard TFs | Only used when auto-calculate is off |
Divergence Settings
| Setting | Default | Enable When |
| RSI Divergence | True | Standard confirmation |
| MACD Divergence | True | Trend momentum confirmation |
| MFI Divergence | False | When volume data is reliable |
| CMF Divergence | False | For accumulation/distribution analysis |
Trading Applications
Application 1: Trend Following
Objective: Enter in the direction of the dominant trend with high confluence
Setup Criteria:
- Summary Score ≥ 60
- Confluence Score > 50% (bullish) or < -50% (bearish)
- Current TF momentum aligned with bias
- Not in extreme zone (avoid late entries)
Entry Trigger:
- For bullish: Zero-line cross up with win rate > 55%
- For bearish: Zero-line cross down with win rate > 55%
Exit Criteria:
- Momentum weakening signal
- Enter extreme zone
- Divergence detected
- Confluence drops below 30%
Application 2: Mean Reversion
Objective: Capture reversals from extreme zones
Setup Criteria:
- Momentum in extreme zone (above upper or below lower band)
- Bars in extreme approaching or exceeding average bars to reversal
- Percentile > 90% or < 10%
- Divergence confirmed (2+ indicators)
Entry Trigger:
- Momentum exits extreme zone (crosses back inside band)
- Or divergence confirmation on lower timeframe
Exit Criteria:
- Momentum reaches zero line (partial)
- Momentum reaches opposite extreme (full)
- Divergence in opposite direction
Application 3: Breakout Confirmation
Objective: Confirm price breakouts with momentum
Setup Criteria:
- Price breaking key support/resistance
- Momentum crossing above/below zero simultaneously
- Confluence Score improving (moving toward direction of breakout)
Entry Trigger:
- Price breakout + momentum confirmation in same direction
Exit Criteria:
- Momentum diverges from price
- Momentum weakening significantly
- Confluence turns negative for your position
Application 4: Multi-Timeframe Alignment Trading
Objective: Only trade when multiple timeframes agree
Setup Criteria:
- TF Alignment shows 4+ timeframes in same direction
- Confluence Score > 70% or < -70%
- Summary Score ≥ 70
Entry Trigger:
- Pullback in lower timeframe to zero zone
- Momentum bouncing from zero in direction of higher TF bias
Exit Criteria:
- Any HTF flips direction
- Confluence drops below 50%
- Extreme zone reached
Alert Configuration
Available Alerts
| Alert Name | Triggers When |
| Zero Cross Up | Momentum crosses above zero line |
| Zero Cross Down | Momentum crosses below zero line |
| Entered Extreme High | Momentum crosses above upper volatility band |
| Entered Extreme Low | Momentum crosses below lower volatility band |
| Bullish Divergence Confirmed | 2+ indicators confirm bullish divergence |
| Bearish Divergence Confirmed | 2+ indicators confirm bearish divergence |
| Strong Bullish Confluence | Confluence score exceeds +80% |
| Strong Bearish Confluence | Confluence score drops below -80% |
| Strong Trend Signal | Summary score reaches 80+ |
Setting Up Alerts in TradingView
- Click the “Alert” button (clock icon) in top toolbar
- Set “Condition” to “Blockcircle Multi-timeframe Momentum Scorecard”
- Select the specific alert from the dropdown
- Configure notification method (popup, email, webhook, etc.)
- Set expiration and click “Create”
Recommended Alert Combinations
For Trend Traders:
- Strong Bullish/Bearish Confluence
- Zero Cross Up/Down
- Strong Trend Signal
For Reversal Traders:
- Entered Extreme High/Low
- Bullish/Bearish Divergence Confirmed
For Systematic Traders:
- All alerts enabled
- Filter in your trading system based on context
Best Practices
Do’s ✅
- Always check the Summary Score first – It provides immediate context
- Confirm with higher timeframes – The HTF bias should support your trade direction
- Respect extreme zones – They warn of potential exhaustion
- Use divergence as a warning, not a signal – Divergence alone doesn’t mean reversal
- Track win rates over time – Your asset may have different characteristics
- Combine with price action – Momentum confirms, price structure defines levels
- Adjust parameters per asset class – Crypto may need different settings than forex
Don’ts ❌
- Don’t trade against strong confluence – Fighting the trend is expensive
- Don’t ignore extreme zones – Late entries have poor risk/reward
- Don’t over-optimize parameters – Default settings work for most cases
- Don’t use in isolation – Always consider price structure and volume
- Don’t chase every zero-line cross – Check win rate and confluence first
- Don’t overtrade in CONFLICTED status – Wait for clarity
Timeframe-Specific Guidance
| Your Chart | Focus On | Caution With |
| 1-5m | Current TF + HTF1 | Too many whipsaws; need tight stops |
| 15-30m | Current + HTF1-2 | Intraday noise; respect daily bias |
| 1-4H | HTF1-3 | Weekend gaps; news events |
| Daily+ | HTF3-5 | Slow signals; need patience |
Frequently Asked Questions
General Questions
Q: What assets does this indicator work with? A: The MMS works with any asset that has price data: stocks, forex, crypto, futures, indices, etc. The momentum calculation normalizes values across different price scales.
Q: What timeframes work best? A: The indicator works on all timeframes. However, very low timeframes (1m and below) may produce more noise. For most traders, 15m to Daily provides the best balance of signals and reliability.
Q: How does this compare to RSI or MACD? A: The MMS incorporates the benefits of both (RSI for overbought/oversold, MACD-like momentum measurement) while adding multi-timeframe analysis, statistical tracking, and volatility-adjusted bands that neither RSI nor MACD offer natively.
Technical Questions
Q: Why do the volatility bands change width? A: The bands are calculated using standard deviation over the lookback period. When the market becomes more volatile, standard deviation increases, widening the bands. In calm markets, they tighten. This adapts the extreme zones to current market conditions.
Q: How accurate is the win rate tracking? A: Win rate tracking begins when you add the indicator and accumulates over time. The more bars of history available, the more reliable the statistics. Look for “RELIABLE” status (5+ data points minimum).
Q: Can I use manual timeframes instead of auto-calculation? A: Yes. Disable “Auto-Calculate Higher Timeframes” in the settings, then configure each HTF manually. This is useful if you have specific timeframes you prefer to analyze.
Q: Why isn’t divergence signaling even though I see it on the chart? A: The MMS requires 2+ indicators to confirm divergence. If only momentum shows divergence but RSI and MACD don’t confirm, no signal is generated. You can enable MFI/CMF for additional confirmation sources.
Trading Questions
Q: Should I enter immediately on a zero-line cross? A: Not necessarily. Check the win rate first – if it’s below 50%, the signal has no statistical edge. Also verify that higher timeframes support the direction and you’re not entering an extreme zone.
Q: What does it mean when the Summary shows “CONFLICTED”? A: This means timeframes are giving opposing signals, momentum health is poor, or there’s no clear directional bias. It’s generally best to wait for clearer conditions rather than forcing a trade.
Q: How should I handle divergence signals? A: Divergence is a warning of potential reversal, not an immediate entry signal. When divergence appears:
- Tighten stops on existing positions in that direction
- Avoid new entries in the divergent direction
- Wait for momentum confirmation before entering the counter-direction
Q: The indicator shows bullish but price is falling. What’s happening? A: Momentum measures rate of change, not absolute direction. Bullish momentum in falling prices means the decline is slowing. This could precede a reversal or just a consolidation before further decline. Look at higher timeframes for context.