The first thing anyone does with a correlation matrix is pick a window. Weekly if you trade actively, quarterly if you hold for months, monthly if you have no strong opinion. Then you read the cell, act on the number, and never look at the other two settings again.
That habit throws away the most useful thing on the panel. The gap between what the three windows say about the same pair is a measurement in its own right, and it takes about a minute to collect. A pair that reads roughly the same across all three is telling you something you can rely on. A pair that swings by half a point depending on which button is pressed is telling you the number is not stable enough to size a position against, no matter which of the three you happened to click.
The three toggles are three different opinions
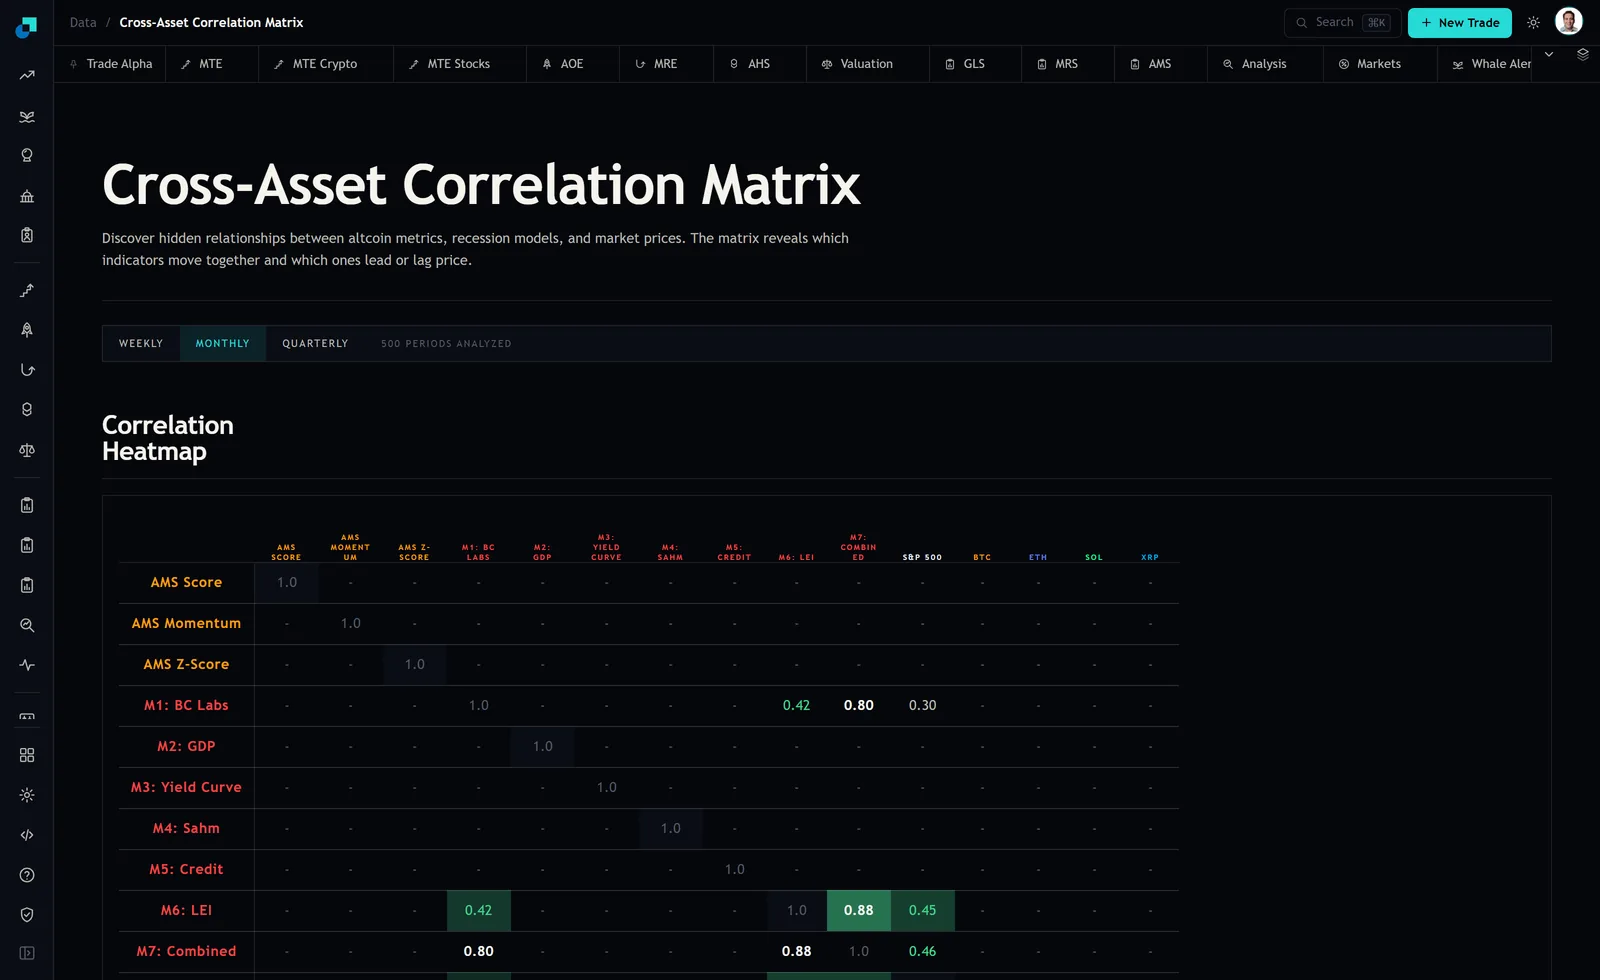
The Cross-Asset Correlation Matrix has WEEKLY, MONTHLY and QUARTERLY sitting in a row above the heatmap, with 500 periods analyzed noted next to them. At the time of writing it was set to MONTHLY, and the recession-model rows carried the only readings on the grid. M6 (LEI) against M7 (Combined) read 0.88, M1 (BC Labs) against M7 read 0.80, and M1 against M6 read 0.42.
Those are the monthly answers. Click WEEKLY and you get the weekly answers, which will not be the same, because a weekly return series and a monthly return series are different data measuring different things. Short windows catch fast co-movement and are noisier. Long windows smooth out the noise and are slower to notice that something has changed. Neither is more correct. They are answers to different questions and the panel is offering you all three for free.
Writing down the spread turns it into a score
The mechanic is as dumb as it sounds. Pick the pair you care about, click each of the three toggles, and write down the three numbers. Then take the highest minus the lowest. That difference is your stability score for that pair.
Say a pair comes back at 0.34 on weekly, 0.61 on monthly and 0.78 on quarterly. The spread is 0.44, which is enormous, and the shape matters as much as the size. Rising with the window length is the classic pattern for two assets that share a slow common driver but move on their own news day to day. You will feel diversified in normal weeks and much less diversified over the horizon you actually hold.
Now say another pair reads 0.66, 0.71 and 0.69. Spread of 0.05. Whatever relationship those two have, it is present at every time scale you can measure it on, and there is no window choice that would have flattered you into believing otherwise. That is a number you can plan around.
My working thresholds after doing this for a while are simple. Under 0.15 of spread, treat the pair as stable and use whichever window matches your holding period. Between 0.15 and 0.30, use the least favourable of the three for sizing, which almost always means the highest. Above 0.30, do not let that pair carry a diversification argument at all.
What a wide spread costs in dollars
Make it concrete with a $10,000 pair, two positions of $5,000, each swinging about 20 percent a year on its own. If the true correlation is 0.30, the pair moves about 16.1 percent a year, and a two standard deviation year is roughly $3,225 of movement.
Take the same pair at 0.85 instead. The pair now moves about 19.2 percent, and the two sigma figure is about $3,847. That is $622 of difference on ten thousand dollars, produced entirely by which number you believed.
Six hundred dollars may not sound like the sort of thing to reorganise a portfolio over, and on its own it is not. The problem is that the wrong number does not cost you once. It sets your position size, so it costs you on every position sized that way, and it does the damage on the day the market falls rather than spread evenly across the year. That $622 is not a rounding error in a bad week, it is the difference between a drawdown you sit through and one you sell into.
The pairs where the ladder tells you nothing
Two situations make the spread unreadable, and both are worth recognising before you act.
The first is missing data. Of the 105 unique pairs available across the fifteen rows on this grid, six carried a coefficient at capture. Everything else, including all four crypto rows against each other and against the S&P 500, showed a dash. A dash is not a zero and it is not a weak correlation. It is the panel telling you it does not have an answer, and a ladder with two empty rungs is not a ladder.
The second is a genuine regime change during the sample. If a pair truly re-correlated four months ago, the weekly window has already noticed, the monthly window is halfway there, and the quarterly window is still averaging in the old world. You will see a wide spread and read it as instability when it is actually a clean, one-directional shift. The tell is the ordering. A monotonic ladder that rises or falls consistently across the three windows usually means a shift. A ladder that jumps around with no order to it usually means noise.
You cannot always distinguish the two from three numbers, and it is worth being honest that this method is a screen rather than a diagnosis. What it does reliably is stop you from treating one window's answer as the answer.
The ten minute version to run this week
Take your actual holdings, not a theoretical universe. List every pair among them, which for five positions is ten pairs and for eight positions is twenty eight. If that already sounds like too many pairs to check, that is a useful finding about the book.
Open the matrix, click through the three windows, and record three numbers per pair in a spreadsheet. Add a fourth column for the spread. Sort by spread descending.
Read only the top three rows. Those are the pairs where your sense of how diversified you are depends most on an arbitrary setting, and they are almost always the pairs you were most confident about, because confidence tends to come from having looked at one number once. For each of them, re-size using the highest of the three readings and see whether the position still looks right. Sometimes it does and you have bought certainty for free. When it does not, you have found a position that only makes sense under the most flattering measurement available, which is exactly the position worth trimming before the market does the trimming for you.
Then put a note in your calendar to run it again in a quarter. The spread itself moves, and a pair that was stable at 0.05 and now reads 0.28 has changed character without any price alert firing anywhere.