Turnover is the field in this asset class that is easiest to manufacture and hardest to audit, and it is also the field most universe construction rules lean on hardest. A leaderboard sorted by 24 hour volume is a ranking of exactly the quantity that a reward programme, a market maker rebate, or two accounts trading with each other would inflate first.
I am not going to tell you that any particular figure on this board is farmed, because the screen cannot support that claim and neither can you from where you are sitting. What is worth doing is building the rule that makes the question moot, so that a universe file survives an audit whether or not the volume was real.
What the board exposes, and the fields it withholds
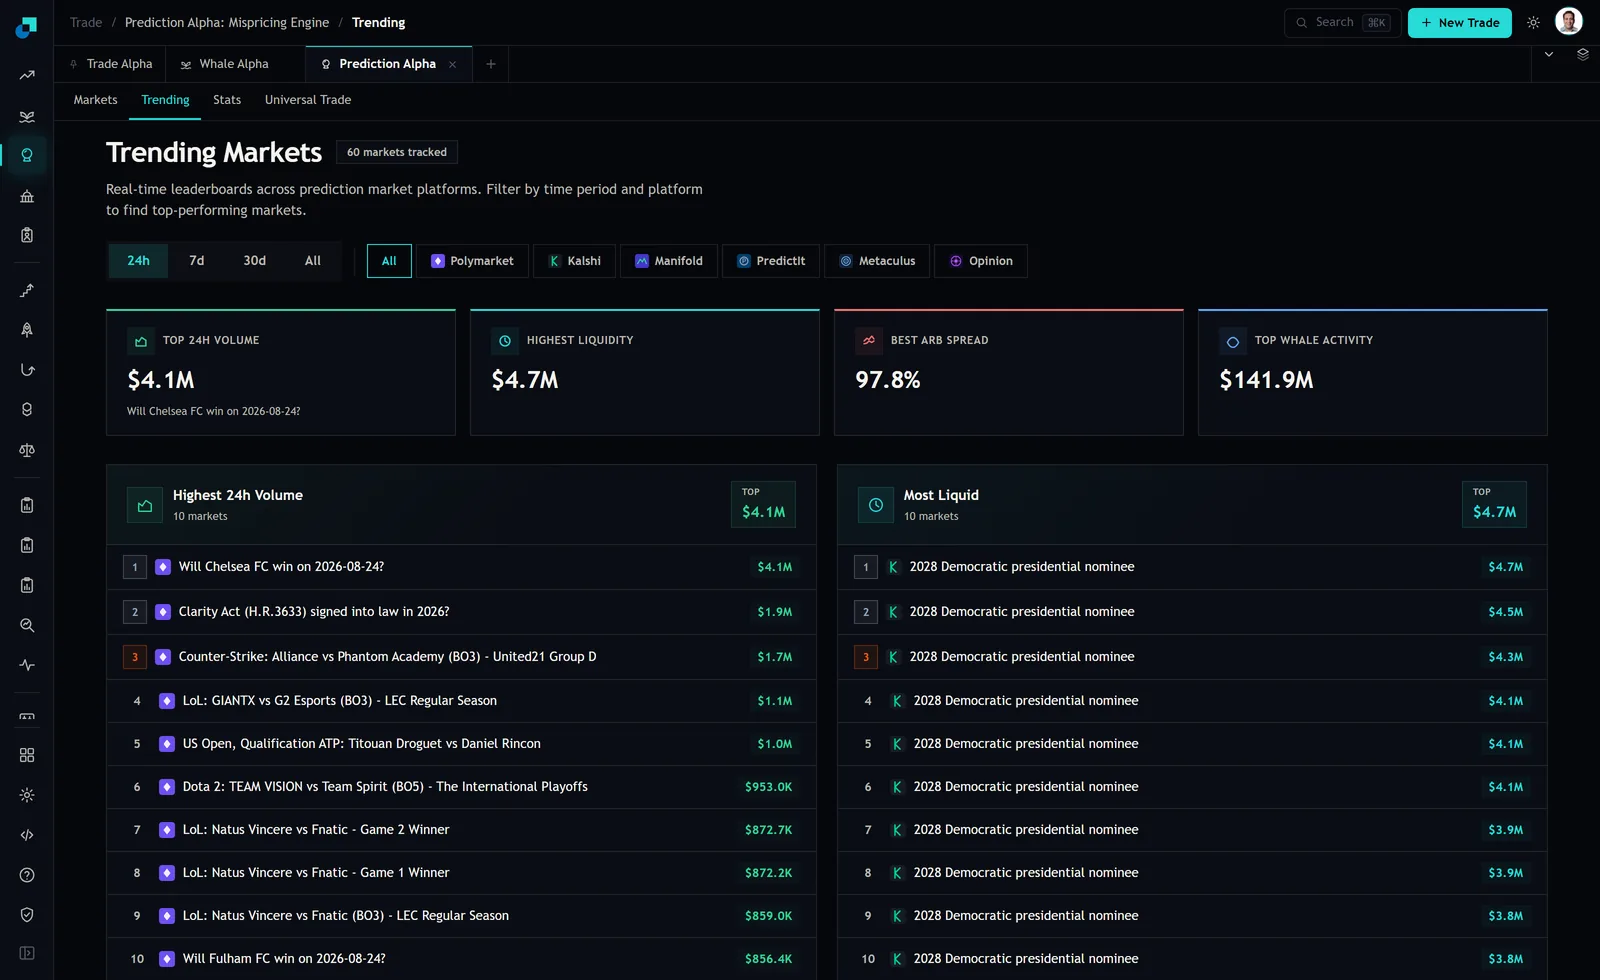
The trending tab tracks 60 markets, with period selectors for 24 hours, 7 days, 30 days and all time, and a platform filter across the six venues. Four tiles sit above two leaderboards of ten rows each: top 24 hour volume at 4.1M, highest liquidity at 4.7M, best arb spread at 97.8 percent, and top whale activity at 141.9M.
Now list what a row actually gives you. A market title. A venue mark. One dollar figure. That is the whole record.
Then list what every published fingerprint of incentivised trading needs: trade count, average print size, the distribution of print sizes, maker against taker split, unique account count, time of day clustering, and the identity or at least the persistence of the accounts involved. Not one of those fields is on this board. A rule that claims to detect farming from a volume leaderboard is a rule that will fail the first time somebody asks how it works, and the honest position for a research file is to say that the detection is not available at this layer rather than to invent a heuristic that sounds rigorous.
Three structural distortions the board does show
Detection is unavailable. Structure is not, and the three problems visible in that capture are large enough to matter more than the farming question.
Venue monoculture. Every one of the ten rows on the 24 hour volume board carries one venue's mark, and every one of the ten rows on the most liquid board carries a different single venue's mark. Whatever you build from the top of this board, you are building a single operator universe on both metrics, and the platform filter above is the only thing standing between you and admitting that by accident.
Leg duplication. The ten most liquid rows are the same question ten times, from 4.7M to 3.8M, because a nominee market lists each candidate as a separate book. Rank without deduplicating and one event occupies your entire shortlist, the depth figure double counts, and a portfolio built from the top ten holds ten positions in one outcome.
Same session expiry. The volume board is led by a football fixture dated the day of capture, followed by esports and tennis matches that resolve on the day they are played. Turnover is partly a measure of how quickly a market dies, so sorting by it selects for contracts with hours of remaining life. That is a horizon mismatch for almost any fund process, and it happens before any question about who generated the turnover.
The exclusion rule, written against auditable fields
Five conditions, each naming the field it uses, each computable from data you can point at.
Collapse to the question before ranking anything. Group rows by event rather than by contract, sum the legs, and rank the groups. This single step removes the duplication distortion and changes both your depth number and your position count.
Require persistence across the trailing window. A market must appear on the board on a stated number of distinct days before it is admitted. Use the 7 day and 30 day period selectors to source that rather than repeated 24 hour snapshots. Single session turnover, whatever its origin, does not survive this and neither does a one day burst.
Impose a liquidity floor in dollars and a turnover to depth ceiling as a ratio. Volume that is a large multiple of resting depth is a churn signature regardless of cause, and it is the closest thing to a farming proxy that this data layer supports. State the multiple in advance and record why you chose it.
Impose a minimum days to resolution. This is the horizon control, and it removes same session fixtures without any judgement about their quality.
Cap the venue share of the admitted universe. Not because concentration is farming, but because a universe drawn from one operator inherits every one of that operator's listing decisions.
Testing the rule instead of believing it
Three measurements, all of which belong in the same file as the rule.
Persistence. Take the markets the rule admits today and re-run the conditions in a week. The fraction still clearing is your stability number, and if it is low the rule is describing noise rather than filtering it.
Survivorship. This board is a top ten, which means it is not a sample of markets, it is the upper tail. Any statistic computed across admitted rows is conditioned on having reached the leaderboard at all, and a rule tuned on the tail will behave differently on the body of the distribution. If you can pull the full market list rather than the board, do the tuning there and use the board only for monitoring.
And the measurement most desks skip: what the rule excludes. Compute the turnover and depth you have removed, not just what you kept. A rule that eliminates the large majority of visible volume has just handed you your capacity number, and that number is more useful to a portfolio manager than the admitted list is. Report both.
What to do about the fields you do not have
Two routes, and you should take both.
Ask for the data. Several venues publish trade level history through an API even when their front end does not surface it. If you can get per print size and timestamps, the standard fingerprints become computable and this whole article turns into a preamble. Put the request in writing and record the answer, because a venue that will not provide trade level data is telling you something about how auditable your P&L from it will be.
And in the meantime, use the one detector you already own, which is your own fill quality. If you are consistently filled instantly at size on a book whose displayed depth said you should not have been, somebody is providing you that liquidity for a reason worth understanding. If your fills are consistently worse than the board's turnover implied, then the turnover was not available to you, which is the only sense in which it was fake that your investors actually care about. Log slippage against the displayed volume and depth on every order, and after a few hundred fills you will have the venue quality dataset that no leaderboard was ever going to give you.