Volume is the only figure on a launch row that the party who benefits from it can manufacture at close to zero cost. Market cap is arithmetic on supply and last price. Liquidity is capital somebody deposited and can lose. Holder count is a level that takes a batch of transfers to move. Volume is a claim about activity, and on a two-day-old token the cheapest way to produce a large one is to trade against yourself through a pool you also own.
This matters more to a desk than to an individual, because a desk does not read rows, it reads screens. A screener sorted or thresholded on volume is a machine for promoting precisely the rows where volume was manufactured, and everything downstream of it inherits the bias without anyone deciding to. The shortlist inherits it. The research queue inherits it. The backtest universe inherits it, and by then it is a data-quality problem wearing the costume of a result.
The identity three columns are supposed to satisfy
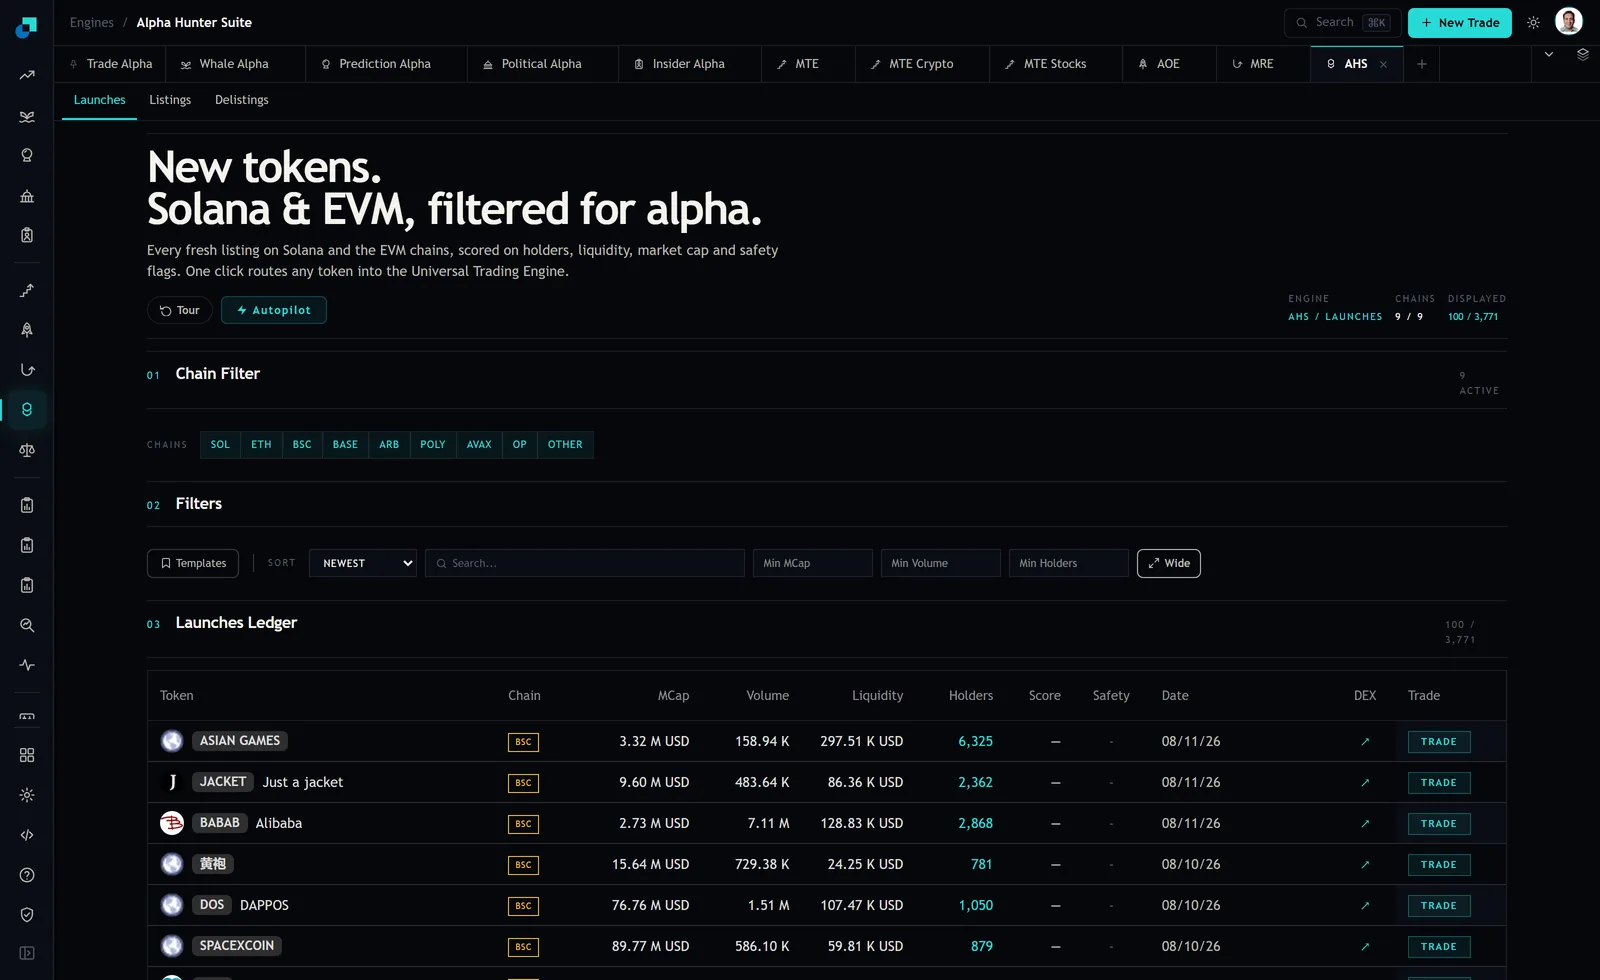
The Alpha Hunter Suite launches ledger puts MCap, Volume, Liquidity and Holders on the same row, which is the whole apparatus you need. The test is not whether any one of them looks plausible. It is whether they can all be true at once.
Two ratios do most of the work. The first is turnover, volume divided by liquidity, which asks how many times the entire pool would have had to change hands to produce the reported tape. The second is volume per holder, which asks what the average participant would have had to trade.
Take real rows off the ledger at capture. One row showed 7.11 M of volume against 128.83 K of liquidity and 2,868 holders. That is turnover of roughly 55 times the pool in the reporting window, and roughly 2,480 dollars of trading per holder. Another row on the same screen, with 158.94 K of volume against 297.51 K of liquidity and 6,325 holders, comes out at turnover of about 0.53 and roughly 25 dollars per holder. Those are not two points on a continuum. They are two different processes.
Why an honest pool cannot produce that turnover
The turnover ratio is not just a heuristic. Constant product pools charge a fee on every swap, and that fee accrues to the deposited capital, so a very high turnover figure implies a very specific and checkable consequence.
Run it on the 55x row. At a typical pool fee in the region of thirty basis points, 7.11 M of swap volume generates something close to 21 K of fees. Against 128.83 K of deposited liquidity that is roughly sixteen percent of the pool, earned in the window. Capital that earns sixteen percent in a day is not capital that stays at 128 K. It attracts deposits, and the liquidity column moves. When the tape says one thing and the deposited capital sits still, the deposited capital is the honest witness.
The same arithmetic gives you the alternative explanation, which you have to take seriously before you exclude a row. High turnover is genuinely possible when the trading is real arbitrage against a deeper venue, or when a single large holder is distributing through a thin pool. Both leave different fingerprints. Arbitrage volume tends to arrive with a widening holder count. Distribution tends to arrive with a falling liquidity figure, because the paired asset is leaving. Wash volume tends to arrive with neither, which is why the three columns are read together rather than in sequence.
What the screen gives you and what it does not
Be precise about the boundary here, because the design of your process depends on it. The launches ledger gives you a Chain chip and a DEX link on each row, and a chain filter across nine chains. It gives you filter inputs for Min MCap, Min Volume and Min Holders. It does not give you a per-venue or per-pool split of the volume figure, and at capture the Score and Safety columns were empty on every visible row.
Two consequences follow. First, venue awareness is a step you take off the screen. The DEX link is the door, and whether the reported volume is concentrated in one pool or spread across several is a question you answer after walking through it. A token whose entire tape sits in a single pool controlled by the deployer is a different object from one trading across three venues at comparable depth, and the ledger row looks identical for both.
Second, and this is the operationally annoying part, every filter on the bar is a floor. Min MCap, Min Volume, Min Holders. A wash-trading test is an upper bound on a ratio, and there is no field on the filter bar that expresses an upper bound. So the exclusion runs after the read, in whatever your desk uses to hold a universe, and it has to be written down as a rule rather than lived inside a saved screen.
Setting the cut, and recording it
A threshold that is argued about once and then written down is worth more than a better threshold that lives in someone's head. Three cuts, stated as exclusions rather than as a score:
- Turnover ceiling. Volume divided by liquidity above a stated multiple, applied only to rows below a stated age, because turnover on a mature token means something different. Pick the multiple by looking at where your own feed's distribution stops being continuous, not by borrowing a number.
- Volume per holder ceiling. Volume divided by holder count above a stated dollar figure. This one catches the case the turnover ratio misses, which is a large pool with a manufactured tape and almost nobody in it.
- Fee-implied yield ceiling. Volume multiplied by an assumed pool fee, divided by liquidity. Above some daily percentage, the row is asserting a return on deposited capital that would not survive a day without attracting deposits.
All three are ratios of numbers already on the row, which means they can be computed on export without a second data source, and they can be recomputed on historical snapshots. That second property is what makes them auditable. A rule you can rerun against last quarter's universe is a rule you can defend in a review.
The recording discipline matters as much as the cut. Excluded rows are moved to a flagged status with the values that triggered the flag, not deleted. A universe file that quietly loses its rejects cannot be used to measure whether the filter was right, and it will silently reintroduce survivorship into anything you build on top of it.
The cost side, which is not small
A filter this aggressive has a false positive rate, and pretending otherwise is how a data-quality rule turns into an unexamined constraint on the strategy.
The rows most likely to be wrongly excluded are the genuinely explosive ones. A real launch that catches a bid does produce turnover far above its resting pool, because the pool is small and the interest is not. If your desk trades day-one momentum, a turnover ceiling set tight enough to eliminate wash trading will eliminate a meaningful share of the events the strategy exists to capture. That is a legitimate tradeoff and it should be made explicitly, with the excluded population measured, rather than absorbed as an invisible drag on hit rate.
The second cost is that none of these tests identify wash trading. They identify rows whose columns do not reconcile. The difference is not pedantic. It governs what you may write in a memo, what you may say to a counterparty, and what conclusion you are entitled to draw when a flagged token later trades normally. The honest formulation is that the row failed a consistency check and left the universe on that basis, which is a statement about your process and is fully defensible, rather than a statement about someone else's conduct, which is not.