There is one comparison on an options screen that changes what I do this week, and it takes about five minutes. Take the implied volatility the chain is quoting, take the volatility the underlying has actually delivered over a comparable recent window, and put them side by side. If implied is well above realised, the market is charging more for movement than the tape has been producing, and selling premium is the side being paid. If realised is above implied, the opposite. Everything else on the screen is detail around that one gap.
The reason this works better than most retail indicators is that both numbers are objective. Neither one requires you to have a view. You are not predicting anything; you are comparing a price to a recent cost of production and noticing which direction the discrepancy runs.
The implied side is on the screen, the realised side is one column of arithmetic
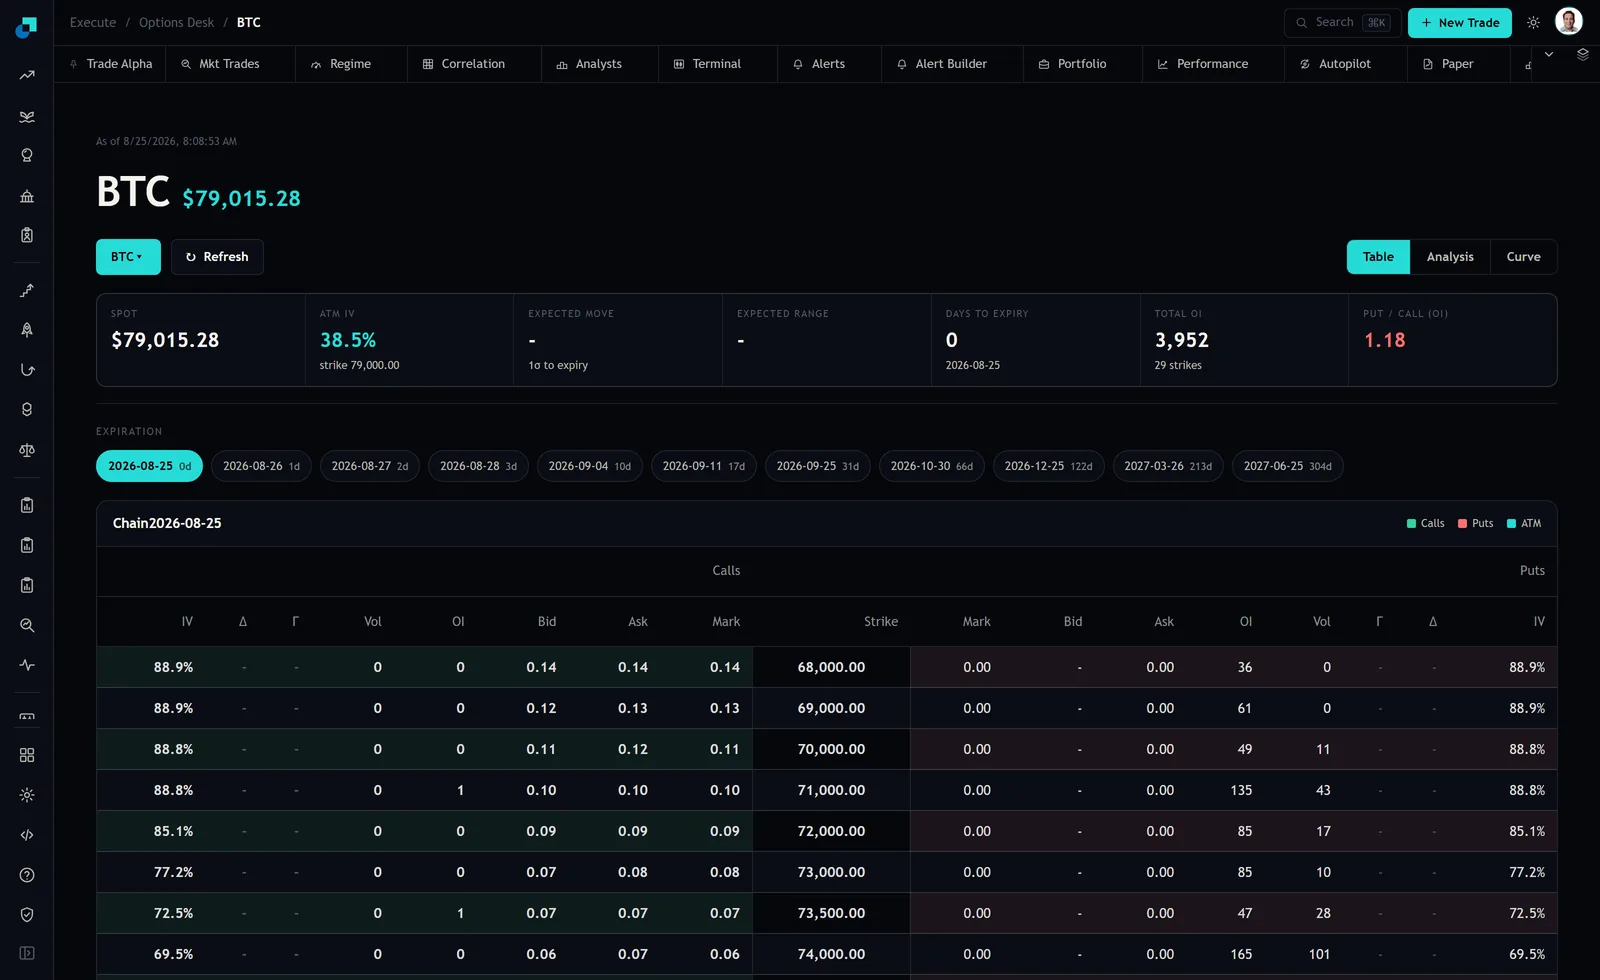
Implied volatility comes straight off the chain. On the Blockcircle Options Desk, reading BTC on 25 August 2026, spot was 79,015.28 and at-the-money implied volatility printed 38.5 percent against the 79,000 strike. That 38.5 percent is an annualised number, which is why it feels abstract, so the first thing I do is convert it into something I can picture.
Divide an annualised volatility by the square root of the number of periods in a year and you get the typical single-period move. For an asset that trades every day, that is the square root of 365, which is about 19.1. So 38.5 divided by 19.1 is roughly 2.0 percent a day. At a spot of 79,015, the options market is charging as though this thing routinely moves about 1,600 dollars a day. For a US stock that trades on business days only, use the square root of 252 instead, which is about 15.9.
The realised side you build yourself, and a spreadsheet does it in one column. Take daily closes for the last 30 days. In the next column compute the natural log of today's close divided by yesterday's. Take the standard deviation of that column. Multiply by 19.1 for a daily-traded asset. That is your 30-day realised volatility, annualised, on exactly the same footing as the number on the chain.
Say that comes back at 30.2 percent. Converted the same way, that is about 1.58 percent a day, or roughly 1,250 dollars at this spot. The chain is charging for 1,600 a day, the tape has been delivering 1,250, and the difference of about 350 dollars a day is the gap the whole decision rests on.
What the gap does and does not mean
Implied above realised is the ordinary condition, not an anomaly. Options are insurance, insurance is normally sold at a markup, and the seller is being paid to carry a risk the buyer wants moved. A modest premium of implied over realised is the resting state of most chains and is not by itself a trade.
What you are looking for is a gap that is large relative to how that same pair has behaved recently. Eight points of premium means something different in an asset where the two lines usually sit two points apart than in one where they routinely diverge by fifteen. Which is why the second thing I do, after computing the current gap, is compute it for a few earlier windows so I know whether today is unusual or ordinary.
The comparison also has a real weakness you should hold in mind. Realised volatility describes the past 30 days. Implied describes the next 30. They are not measuring the same interval, and when implied sits far above realised it is sometimes because the market knows something specific is scheduled that the last 30 days did not contain. A high gap is a question, not an answer, and the question is always the same one: is there a reason the next month should be more violent than the last one.
The decision, and the three cases where I ignore it
When implied is meaningfully above realised and I can find no scheduled reason for it, I lean toward being a seller of premium rather than a buyer. When realised is above implied, I stop selling and, if I want exposure at all, I own options instead. That is the rule.
Three situations override it. The first is a known event inside the option's life. If earnings, an unlock, a court date or a policy meeting falls before expiry, the premium over realised is not mispricing, it is the event, and selling it is taking a position on the event whether you meant to or not. The second is a regime change in progress. Realised volatility is a lagging measure by construction, so at the start of a genuine breakdown realised is still reporting the calm that just ended while implied has correctly repriced. Selling into that gap is the classic way this analysis loses money. The third is a thin chain. If the strikes carry almost no open interest, your realised-versus-implied edge is smaller than the bid-ask spread you will cross twice, and the edge is theoretical.
Sizing it, and being honest about the losing side
Suppose the gap is real and you decide to sell. The important thing to understand is the shape of the outcome, because premium selling produces a long run of small wins and an occasional loss that is much larger than any of them. That is not a flaw in the execution; it is the product you are selling. You are the insurer, and insurers pay claims.
Sold naked, the profile is genuinely severe. A short call with no stock behind it has no cap on the loss, because there is no ceiling on the price of the underlying. A short put obliges you to buy at the strike no matter how far the underlying has fallen, so the loss runs down to zero and can be many multiples of the premium collected. On a 79,000 strike, that is a commitment measured in tens of thousands of dollars against a premium measured in hundreds. If the account cannot absorb that, the trade is not a smaller version of the same idea, it is a different idea, and the defined-risk version of it is a spread where the long leg fixes the worst case at a number you can state before you enter.
Buying premium when realised exceeds implied has its own honest description. Most long options expire worthless, and the loss is 100 percent of what you paid. Being right that volatility is underpriced does not save you if the movement happens in the wrong direction or arrives the week after expiry.
The gap says nothing about direction
This is the part that trips people up most often. Discovering that implied volatility is rich tells you the price of movement is high. It tells you nothing whatsoever about which way the underlying goes. A trader who reads a rich implied number and sells puts has made two decisions, one about volatility and one about direction, and only the first one has any support from the analysis.
If you want the volatility view without the directional one, the structure has to be roughly balanced around the current price, and you have to accept that its worst outcome is a large move in either direction rather than a decline in one. If you want the directional view, take it on its own merits and stop pretending the volatility gap justified it. Keeping those two decisions separate on paper, before the ticket, is the single cheapest discipline available in options trading, and the 350 dollars a day of premium in the example is only worth chasing if you have not quietly bet the other 79,000 on something you did not analyse.