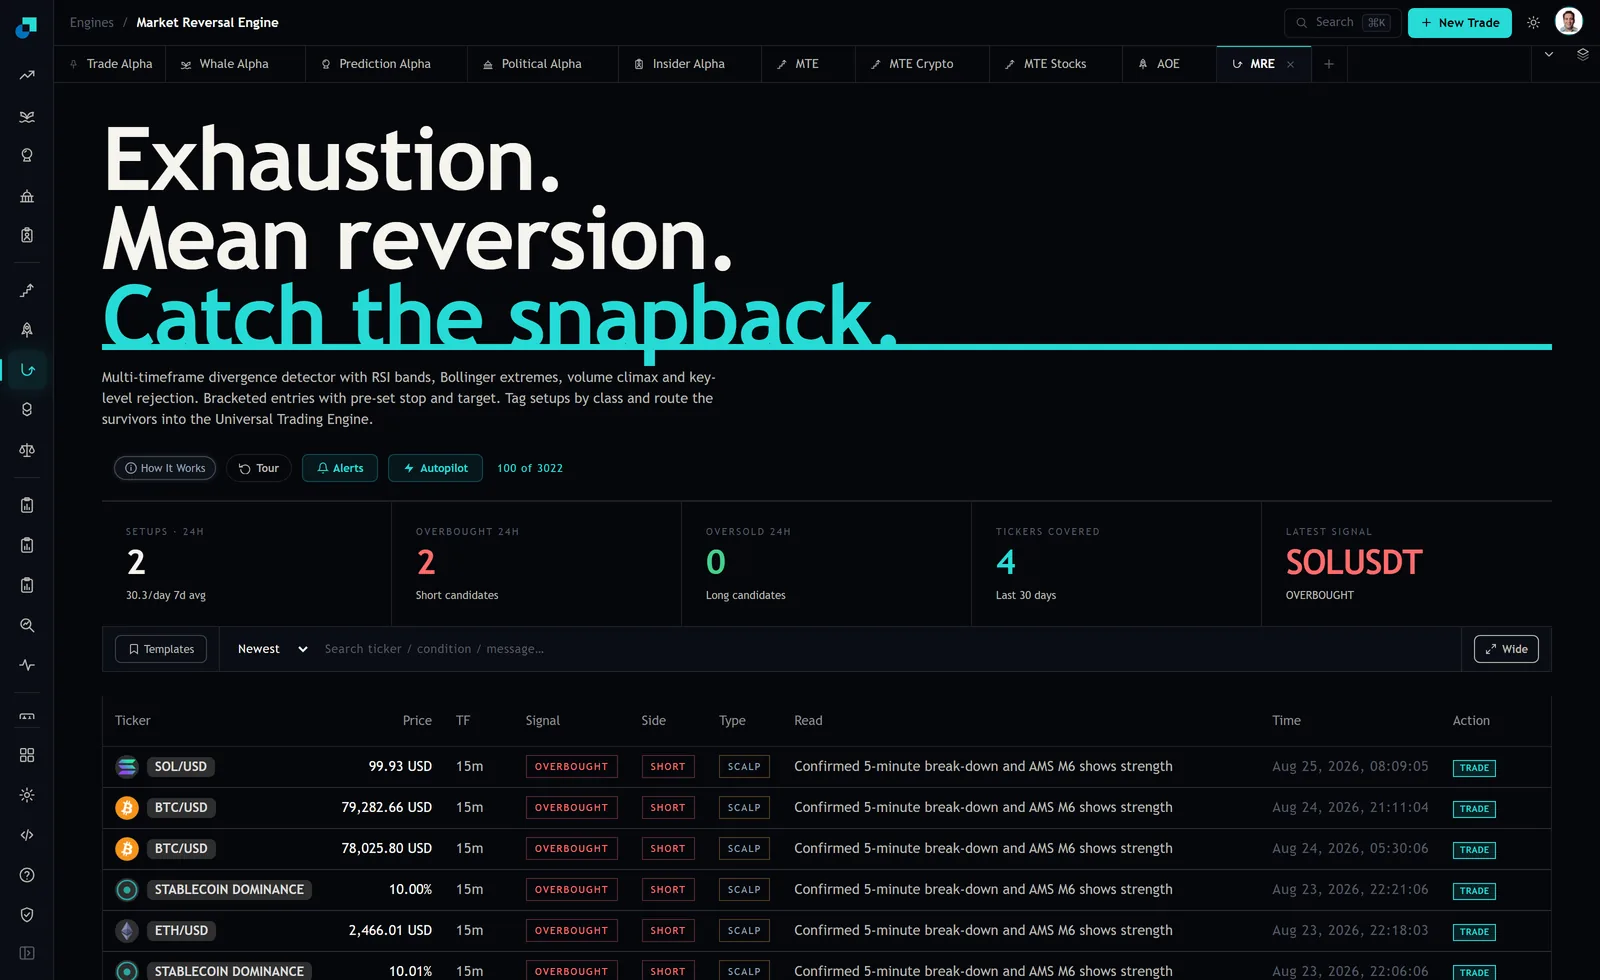
Two tiles sit next to each other on the MRE dashboard. OVERBOUGHT 24H, labelled short candidates. OVERSOLD 24H, labelled long candidates. Most people read them as a work queue: here are the shorts, here are the longs, go and pick. The more useful reading is the ratio between them, treated as a breadth measurement in its own right, because the balance of the two counters is a statement about the whole covered universe rather than about any one instrument in it.
That reading is only worth taking if you check one thing first, and almost nobody does.
Three tiles, and only one ratio
At capture the tiles read SETUPS 24H of 1, with 30.1 per day as the seven day average underneath it, OVERBOUGHT 24H of 1 against OVERSOLD 24H of 0, and TICKERS COVERED of 4 over the last thirty days. The Latest Signal tile named AMS M3 on BTC/USD, tagged OVERBOUGHT.
A one to zero split is, in ratio terms, infinitely lopsided. It is also completely meaningless, and the reason is sitting in the tile immediately to the left. One setup in twenty four hours, against a running average of 30.1 a day, is a day on which the engine essentially did not fire. The skew is being computed on a sample of one.
This is the check, and it is the whole article in one sentence: read the setup count before you read the skew, and if the count is small relative to the seven day average, there is no skew to read.
Check the denominator before you read the skew
Two denominators matter and they are both on screen.
The first is the day's own setup count against the seven day average. A skew computed on one or two setups is noise with a big number attached. My working threshold is that I want the day's count to be at least half the running average before the split means anything, which on a 30.1 average means about fifteen setups. Below that I read the low count itself as the signal, which is the last section of this piece.
The second is the size of the covered universe. Tickers covered read 4 in the capture. Four instruments is a small breadth sample no matter how many signals they generate, and it means a single instrument firing repeatedly can carry the entire skew. When the engine emits five overbought rows and four of them are the same ticker, that is one instrument being stretched, not a market being stretched. The setup table lets you check this directly: group the rows by ticker before you conclude anything from the tiles.
There is a third adjustment specific to this universe. One of the covered instruments in the capture is stablecoin dominance, which appears twice in the visible rows at 10.00 and 10.01 percent, both tagged OVERBOUGHT and SHORT. Stablecoin dominance rising is money sitting out of risk assets, so an overbought reading on it does not belong in the same bucket as an overbought reading on BTC/USD. It points the other way. Strip it out of the counters, or at minimum count it separately, before you read the split. A tile that adds an inverted instrument to a directional count is arithmetically fine and analytically wrong.
What a genuinely heavy one-sided day is telling you
Once the denominator clears, the skew starts carrying information, and it is worth being precise about what kind.
A day where overbought candidates heavily outnumber oversold ones means the covered universe got extended upward together. That is a breadth statement and it has two very different readings depending on what else is true. If a handful of instruments are stretched and the rest are quiet, that is normal rotation and it is not a market event. If nearly everything covered is stretched at once, the market is moving as one thing, and correlated extension is the condition where a single catalyst can unwind a lot of positions at once.
The useful part is that this reading applies to positions you already hold, not just to the setups on screen. A heavily overbought skew is a reason to look at the risk already on your book, and it does not require you to take a single short. Most retail accounts have this backwards. They see six short candidates and reach for a short. The better response, nine times out of ten, is to notice that your existing longs are all leaning the same way and to trim one of them.
Thresholds here are conventions and I will label them as mine rather than dressing them up as measurements. On a day with adequate setup count, I treat a skew inside roughly two to one as normal chop, three to one or worse as a real one-sided tape, and everything on one side with nothing on the other as a condition worth writing down rather than trading. Those are working rules that keep me consistent, not numbers anyone has proven to me.
Trading the skew instead of the rows
Here is the concrete version, which takes about a minute a day.
- Read the setups count against the seven day average. Small count, stop here.
- Read the overbought and oversold tiles, then open the setup table and pull out any stablecoin dominance rows and any ticker that is repeating.
- Turn what is left into a single number, the share of adjusted setups on the overbought side.
- Use that number on your existing book, not on new entries. Heavy overbought means trim, tighten, or do nothing. Heavy oversold means your cash has more to do than usual.
- Only then look at whether any individual row is worth the careful read.
The reason to do it in that order is that step four is a decision you can act on with size, and step five is a decision you can act on with a small clip. Getting exposure roughly right is worth more to a retail account over a year than getting any single reversal entry right, and the tiles speak to exposure much more reliably than they speak to entries.
The quiet days are a reading too
Go back to the capture. One setup in twenty four hours against a 30.1 per day average is roughly a thirtieth of normal. That is not a broken feed, it is a description of the tape: an engine looking for RSI extremes, Bollinger extremes, volume climax and key-level rejection found almost nothing to flag, which means price was not doing any of those things anywhere in its covered universe.
Low setup counts tend to come with compressed ranges, and compressed ranges are the environment where reversal trading works least well, because the whole method depends on something being stretched far enough to snap back. On days like that the correct action for a retail account is usually to close the tab. There is a version of this job where you find something to do every day, and it is the version that loses money slowly.
The counters are also worth watching over a week rather than a day, because a run of unusually low daily counts followed by a sudden cluster on one side is a more interesting sequence than either reading alone. That is the pattern where a range has been compressing and then breaks, and it is visible in the tiles days before it is obvious on any single chart.