The panel is called Regime Probability Scores and the word probability does a lot of damage. It invites you to read the bars as a pie chart, one market environment carved into shares that must add to a hundred, in which case a score of 75 for one regime leaves only 25 to go around and two bars above 50 would be a contradiction.
They are not shares of anything. Here is the arithmetic that settles it in one line.
Three bars, one hundred and seventy five points
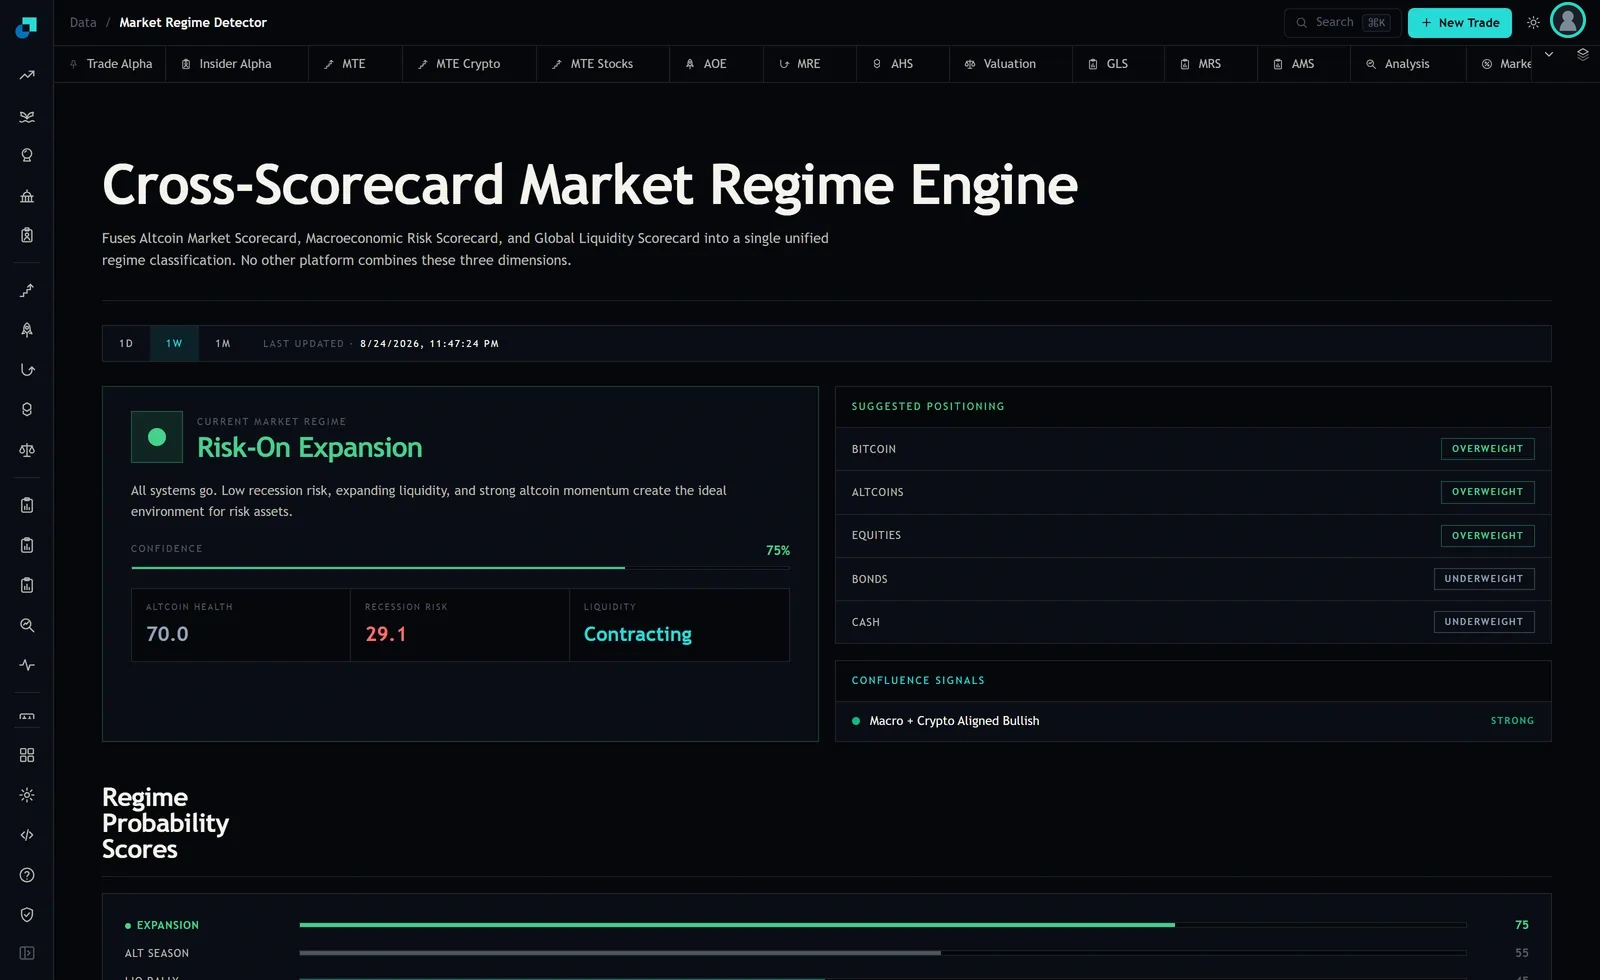
In the capture I am working from, the visible bars read Expansion 75, Alt Season 55 and Liq Rally 45. Add those three and you get 175. The panel continues below the fold in my capture, so there may well be more bars underneath, and every one of them can only push the total higher.
A distribution cannot do that. So whatever these numbers are, they are not slices of a single pie, and the intuition that a high score for one regime must suppress the others is simply wrong.
What they behave like instead is a rack of independent gauges. Each bar answers its own question on its own zero to one hundred scale, with no requirement to coordinate with its neighbours. Expansion 75 says the conditions associated with expansion are strongly present. Alt Season 55 says the conditions associated with an altcoin-led market are moderately present. Neither statement constrains the other, and both can be true.
What a standalone score can and cannot tell you
Two things follow immediately and both change how you read the screen.
The first is that you cannot treat the gap between two bars as a difference in likelihood. Expansion at 75 against Alt Season at 55 is a twenty point gap between two separately scaled meters. It is not a statement that expansion is any particular amount more likely than an altcoin-led market, because neither number was ever a likelihood.
The second is that a low bar is not a denial. Liq Rally at 45 does not mean a liquidity rally has been ruled out. It means the conditions that gauge tracks are middling. That reading sits perfectly comfortably alongside the liquidity tile on the card, which in the same capture read Contracting, and the two together tell a coherent story about conditions rather than a contradictory one about forecasts.
There is one detail worth checking on your own screen. The confidence figure on the regime card read 75 percent and the top bar read 75. Those matching in one capture is not proof of anything, but if they keep matching, the confidence number on the card is simply the winning regime's own score rather than a separate calculation, and you should stop treating it as extra information.
Expansion and Alt Season hot together is one market, not two
When two bars run hot at once, the first question is whether the two regimes are rivals or relatives.
Expansion and Alt Season are relatives. A broadly risk-seeking market is more or less a precondition for money rotating into the more speculative end of crypto. These two gauges are not competing to describe the same fact, they are describing a general condition and a specific expression of it, and the general one running hotter than the specific one is the ordinary case rather than a puzzle.
So do not read it as two independent confirmations of the same trade. This is the single most expensive misreading available on this screen. Two hot bars from two related gauges are one bet with two tickets, and sizing as if you had two separate signals is how a moderate tilt turns into a concentrated one without anybody deciding to concentrate.
The genuinely informative case is the opposite one, and it is worth waiting for. If a risk-seeking gauge and a defensive gauge are both hot at the same time, the inputs disagree with each other. That is not a signal to pick the higher one. It is a signal that the environment is unclassifiable right now, and the correct response to an unclassifiable environment is a smaller position, not a more decisive one.
Trade the overlap, not the sum
The practical rule I use with overlapping scores is to take the intersection of what they imply and never the union.
Work it through on the capture. Expansion running hot argues for owning risk assets broadly, and the Suggested Positioning panel on the same screen said as much with overweight on bitcoin, altcoins and equities. Alt Season at a moderate 55 argues for favouring altcoins over bitcoin inside whatever crypto exposure you have.
The intersection is a risk-on allocation with a mild altcoin lean inside the crypto sleeve, funded from within the sleeve by holding proportionally less bitcoin. The union would be a risk-on allocation plus an extra altcoin position stacked on top, which raises your total exposure on the strength of a bar reading 55. One of those is a tilt. The other is leverage on a moderate gauge.
The intersection rule also handles the awkward cases automatically. Where two hot gauges imply incompatible things, their intersection is small or empty, and an empty intersection tells you to do nothing. That is the answer you want a rule to produce when the screen is genuinely ambiguous.
The gap is a stability reading, and it is the one to log
The bars are still useful for sizing, just not in the way the word probability suggests. What the top two bars give you is a read on how settled the classification is.
A twenty point gap, as in this capture, means the leading gauge is clear of its nearest neighbour and the label on the card is unlikely to change on a small move in the inputs. A three point gap between the top two means the name on the card is one ordinary week away from being a different name, and any allocation you build on that name inherits the instability.
So write down two numbers each time you open the screen, not one. The top score and the gap to the second. Thirty seconds a week, and after a couple of months you will know roughly how wide the gap needs to be in your market before the label sticks. That threshold is the piece of information the panel cannot give you and your own log can, and it is what turns a rack of gauges into a rule you can actually follow when the bars are close.