The People's Bank of China is one of the eight central banks the Global Liquidity Scorecard tracks, sitting in the same list as the Fed, the ECB and the Bank of Japan. Being in the same list invites you to read it the same way, and that is the mistake. If you watch the China line for the shape you have learned to expect from the Fed, you will conclude that China is doing nothing during periods when China is doing a great deal, and you will be surprised when credit conditions there change without any warning that your chart was set up to give you.
The Fed puts its easing in one number and China does not
The reason the Fed's balance sheet became the default proxy for liquidity is that it happened to be an unusually honest one for a while. When the Fed buys assets, its holdings rise, and the payment creates bank reserves. Size goes up, reserves go up, and the two move together in a way you can read off a single line. That is a genuinely convenient property and it made a generation of traders into balance sheet watchers.
The PBoC's main instruments do not have that property. Its most consequential easing tool historically has been the reserve requirement ratio, the share of deposits banks must hold at the central bank rather than lend out. Cutting that ratio releases funds banks already hold. It changes what the banking system is permitted to do with money that exists. It does not require the central bank to buy anything, so the size of its balance sheet need not change at all.
The result is that a major easing action in China can land on your chart as a flat line. Not a small move. No move.
Why a reserve requirement cut is invisible to a size metric
Work through the plumbing once and you will not need to again.
Bank deposits sit on bank balance sheets. A portion of those deposits must be held as reserves at the central bank, and that portion is set by the required ratio. Lower the ratio and a chunk of what was locked up becomes free to lend. The banking system's capacity to create credit expands immediately.
Now look at the central bank's own books. Its assets have not changed, because it bought nothing. Its total liabilities have not changed either, because the same reserves are still sitting there. What changed is the label on part of them, from required to excess. A metric that reads the total misses the entire event.
Policy lending facilities behave differently again. When the PBoC lends to banks through its various facilities, that does show up as an asset, so the balance sheet does move. But those loans have terms, they get rolled or repaid, and the resulting line moves in steps and reversals rather than in the long smooth accumulations that asset purchase programmes produce. A repayment that shrinks the line is not tightening in the sense a chart reader would infer.
Where Chinese easing does become visible
If it is not in balance sheet size, it is in the aggregates that measure credit rather than the central bank's own footprint.
The module lists global M2 money supply among its key metrics, alongside aggregate central bank balance sheets, USD liquidity indicators and credit spreads. That matters here. M2 is where a reserve ratio cut eventually shows up, because the point of the cut is to let banks create more deposits through lending. The transmission is indirect and it takes time, but the channel exists and it is one of the inputs the composite is built on.
The broader credit measures are the same story. Bank lending, policy bank lending and the total flow of credit to the real economy are the variables Chinese policy is actually aimed at. If you want to know whether China is easing, those are the series to read, and they are published separately from anything a balance sheet chart shows you.
The practical consequence is that the China contribution to a global liquidity read arrives with a different lag and a different shape than the US contribution. Not later in some vague sense. Later because it has to pass through the banking system before it registers, whereas an asset purchase registers on the day it settles.
The exchange rate layer that moves the line for no policy reason
One more complication, and it cuts the opposite way.
For long stretches the dominant asset on the PBoC's books has been foreign exchange, accumulated as a by-product of managing the currency. That has an awkward implication for anybody reading the line as a policy signal. When the central bank buys or sells foreign currency for exchange rate reasons, the balance sheet moves. The move looks exactly like a monetary policy action on a chart and is not one.
Layer on top of that the fact that every non-dollar central bank has to be converted into a common unit for a global composite to exist, and the toolbar on the module carries a base currency selector currently set to USD. So the China line you look at is the yuan-denominated series multiplied by an exchange rate that has its own life. A currency move alone can tilt the line.
You now have two separate ways for the China line to move without any change in Chinese monetary policy, and one major way for Chinese monetary policy to change without moving the line at all. That is the full extent of the problem, stated plainly.
How I read the China contribution without getting fooled
Four habits, none of which take more than a minute.
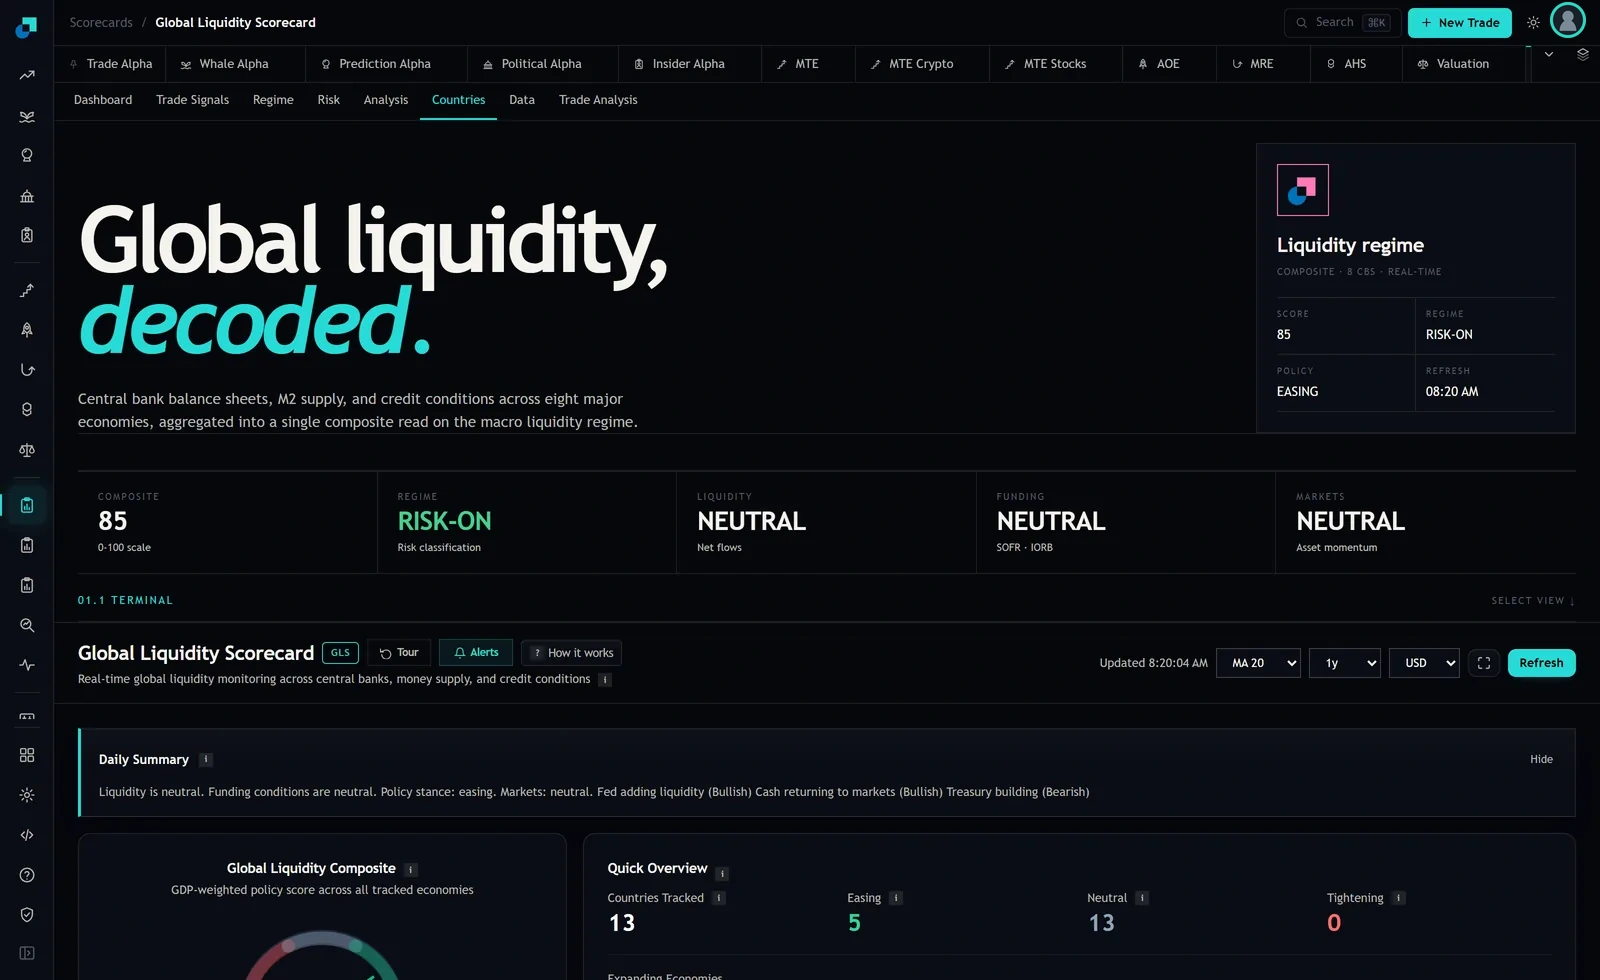
Read stance, not size. The Countries tab classifies economies as easing, neutral or tightening, and on the capture in front of me the counts are 13 tracked, 5 easing, 13 neutral and 0 tightening. A stance classification can register a reserve ratio cut that a size metric cannot. Note that those three counts do not add up to the tracked total, so treat them as three separate reads rather than as slices of one total.
Expect steps, not slopes. Chinese policy easing tends to arrive as discrete announcements rather than as a programme running quietly in the background for months. A flat line punctuated by jumps is the normal shape, and a flat stretch is not evidence of inaction.
Check the currency before forming a view on a move. If the line moved and the yuan moved by a similar magnitude in the same week, you are probably looking at translation rather than policy. This is a thirty second check and it will save you from at least a few confident wrong conclusions a year.
And do not net China against the US in your head. A retail framework that says liquidity is neutral because the Fed is adding and China is flat has almost certainly mismeasured the China half. Two central banks whose easing shows up in different variables on different timescales cannot be summed by eye, which is precisely the work a weighted composite exists to do for you.