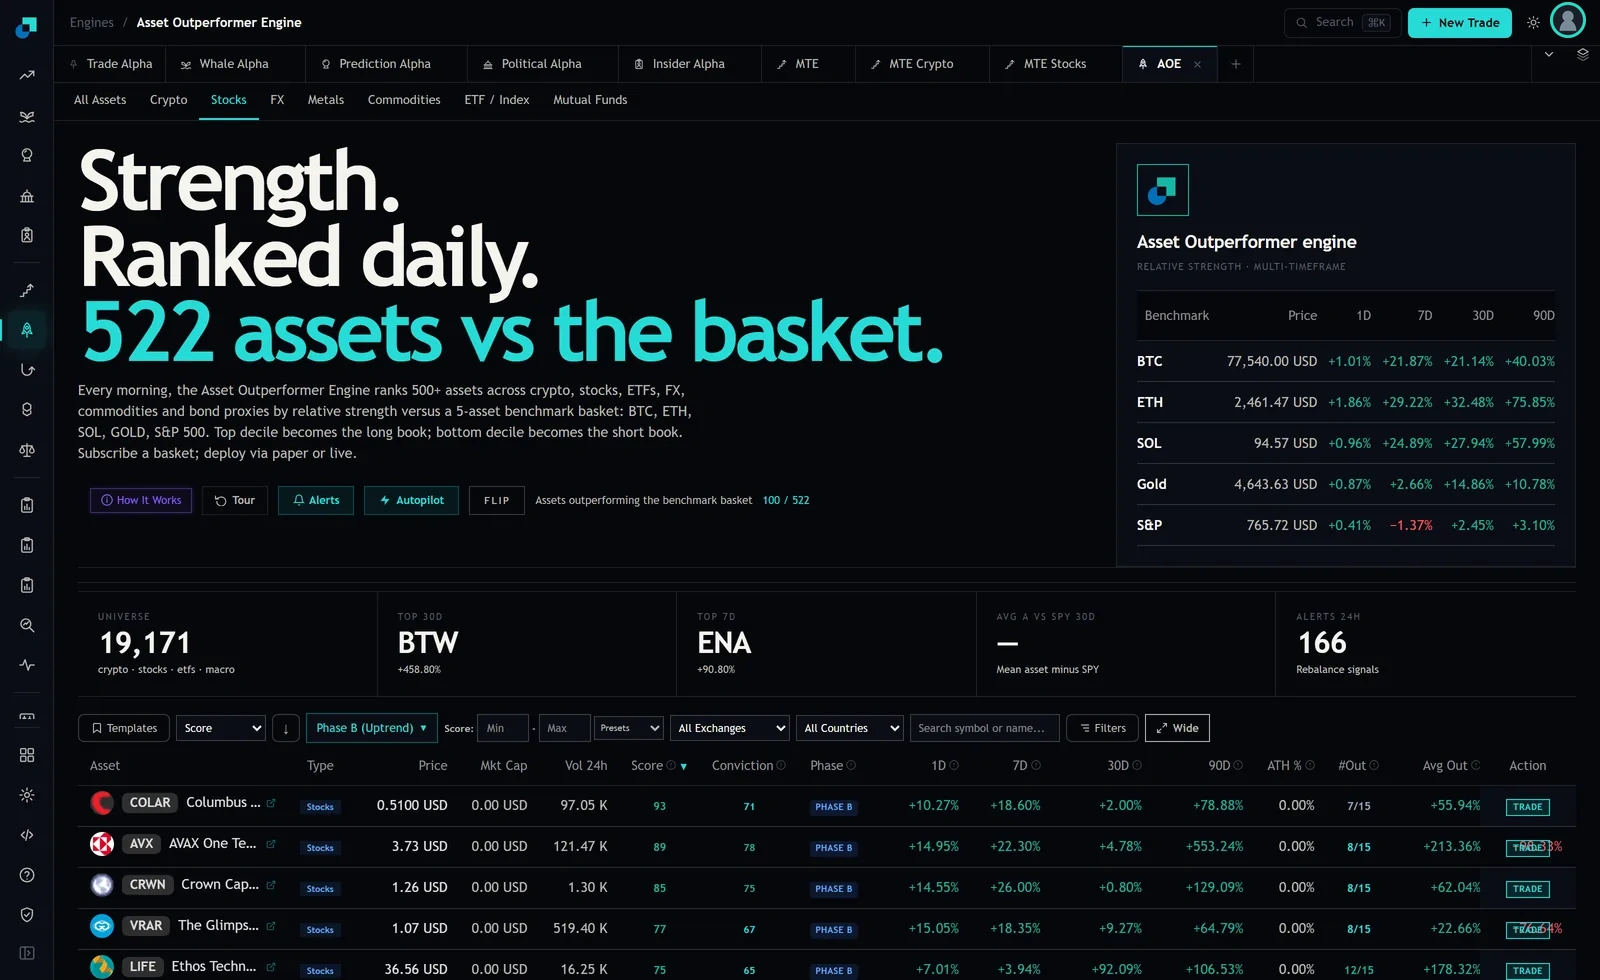
The Stocks tab of the Asset Outperformer Engine ranked 522 names at capture and flagged 100 of them as outperforming the benchmark basket. The number that decides what you can do with that list is not in the Score column. It is in Vol 24h, which on the visible rows read 97.05 K for COLAR, 121.47 K for AVX, 1.30 K for CRWN, 519.40 K for VRAR and 16.25 K for LIFE. Those five figures, and not the scores of 93, 89, 85, 77 and 75 sitting beside them, set the maximum size of any sleeve built from the top of this board.
Capacity work is usually done at the end, after the research is finished and someone asks how much the strategy can take. Done in that order it produces a number that flatters the strategy, because by then nobody wants to hear that the third-best idea is unfundable. Done first, it changes which names are eligible to be ideas at all.
Resolve the unit before you touch the arithmetic
The column header is Vol 24h with no unit attached, and the row gives you no way to settle whether it is share count or notional. For CRWN at 1.26 USD the distinction barely matters: 1.30 K shares is about 1,638 dollars of turnover, and 1.30 K dollars is about 1,032 shares. Either reading says the same thing, which is that the name cannot absorb an institutional order.
For LIFE at 36.56 USD the two readings are a factor of thirty six apart. Sixteen thousand two hundred and fifty shares is roughly 594,000 dollars of daily turnover, which is a small but real position. Sixteen thousand two hundred and fifty dollars is not a position, it is a rounding error in your commission budget. You cannot size against a column whose unit you are guessing at, so the first task is to confirm the unit against your own market data feed on two or three names and write the answer down where the desk can see it.
The second correction is that twenty four hours of turnover is not average daily volume. A single session can run at five times a name's normal rate or at a fifth of it, and on a board sorted by relative strength you are systematically looking at names having an unusual day. Treat the board's figure as a triage field that tells you which rows are worth pricing, and compute the actual twenty or sixty day ADV from your own data before any number reaches a sizing model.
Participation limits turn a rank into a position cap
The standard form is simple enough to do in your head. A maximum position is the participation rate you are willing to run, times ADV, times the number of days you will accept to build. Ten percent of volume over five days gives a cap of half of one day's turnover. Fifteen percent over three days gives you 0.45 of a day. The exact policy varies by desk and by how much information leakage you are willing to eat, but the shape is always the same, and the output is a hard dollar ceiling per name.
Apply that to the visible rows, reading Vol 24h as notional and using a ten percent by five day policy, and the ceilings come out as roughly 48,500 dollars for COLAR, 60,700 for AVX, 650 for CRWN, 259,700 for VRAR and 8,100 for LIFE.
Those are build ceilings, and a build is voluntary. The exit is not. If the reason you are selling is that the thesis broke, so is everyone else's, and the liquidity you sized against is the first thing to disappear. Most desks that get this wrong got the entry arithmetic right and never ran it a second time at a stressed participation rate. Size the position on the liquidation you would be forced into, not the accumulation you have planned.
Capacity binds at the top of the list, not the bottom
The intuition people carry over from large cap work is that the constraint bites on the names you like least, the marginal additions at the bottom of the sleeve that you could drop without much cost. On a relative strength board the opposite is true, and the reason is structural rather than accidental.
A screen that ranks by outperformance against a benchmark basket rewards the moves that are large relative to the market. Large relative moves happen most easily where there is least capital to move against, so the top of the ranking fills with names that are thin by construction. CRWN at capture was the third-best idea on the board by score and the worst asset in the sleeve by any liquidity measure. That is not a data problem. That is the screen working as designed and handing you the bill.
The practical consequence is that you cannot fix capacity by trimming the tail. The tail is where the liquid names are. Trimming it concentrates the sleeve further into exactly the rows that cannot take size.
Solving backwards for the sleeve's maximum AUM
Take the equal weight case first, because it is what most people build. Fifteen names at 6.67 percent each means the sleeve is capped by its thinnest constituent divided by that weight. With a 650 dollar ceiling on the thinnest name, the equal weighted sleeve tops out somewhere under ten thousand dollars. Equal weighting a rank ordered list is the single most expensive decision available on this board, and it is usually made without being noticed, because equal weight looks like the absence of a decision.
Now liquidity weight instead. Set each name's weight proportional to its own capacity and the sleeve's ceiling becomes the sum of the individual ceilings, which across those five rows is about 378,000 dollars. That is a forty fold improvement, and it comes at a price you have to look at directly. The resulting weights are roughly 12.8 percent, 16.1 percent, 0.2 percent, 68.8 percent and 2.2 percent. The sleeve is now a VRAR position with garnish. Score 77 holds more than two thirds of the risk while score 85 holds two tenths of one percent. Liquidity weighting preserved the capacity by deleting the signal it was supposed to express.
The version that survives review is the third one. Set a minimum viable position first, say twenty five basis points of the sleeve, then drop every name whose participation ceiling falls below it and re-rank what is left. That converts capacity from a weighting problem into an eligibility problem, which is where it belongs. It also gives you an honest answer to the question of what the strategy holds: it holds the fundable subset of the ranking, and you can state the size of that subset.
The number that goes in the mandate document
Two capacities exist and they get confused constantly. Strategy capacity is what the approach could take if you ran it across the whole eligible universe. Sleeve capacity is what this particular implementation, with this rebalance frequency and this minimum position, can hold. The second is always smaller and it is the one clients are actually buying. Publishing the first is how a strategy ends up soft closing eighteen months after launch with a note nobody can defend.
Recompute it on a schedule rather than at inception. The engine runs a full scan every six hours, so the shortlist rotates on its own and the liquidity profile of the sleeve rotates with it. A capacity figure computed against last quarter's names describes a portfolio you no longer own.
Last, the ADV you are sizing against is not exclusively yours. Any screen distributed to subscribers produces correlated demand on the same rows on the same morning, and your ten percent participation assumption quietly becomes a much larger share of the marginal liquidity when others are working the same list. There is no field on the board that tells you how crowded a row is. The defensible response is to haircut the participation rate on the thinnest names specifically, because that is where a handful of other buyers is enough to move the print, and to keep a record of the haircut so that a poor fill six months from now is a documented cost rather than a surprise.