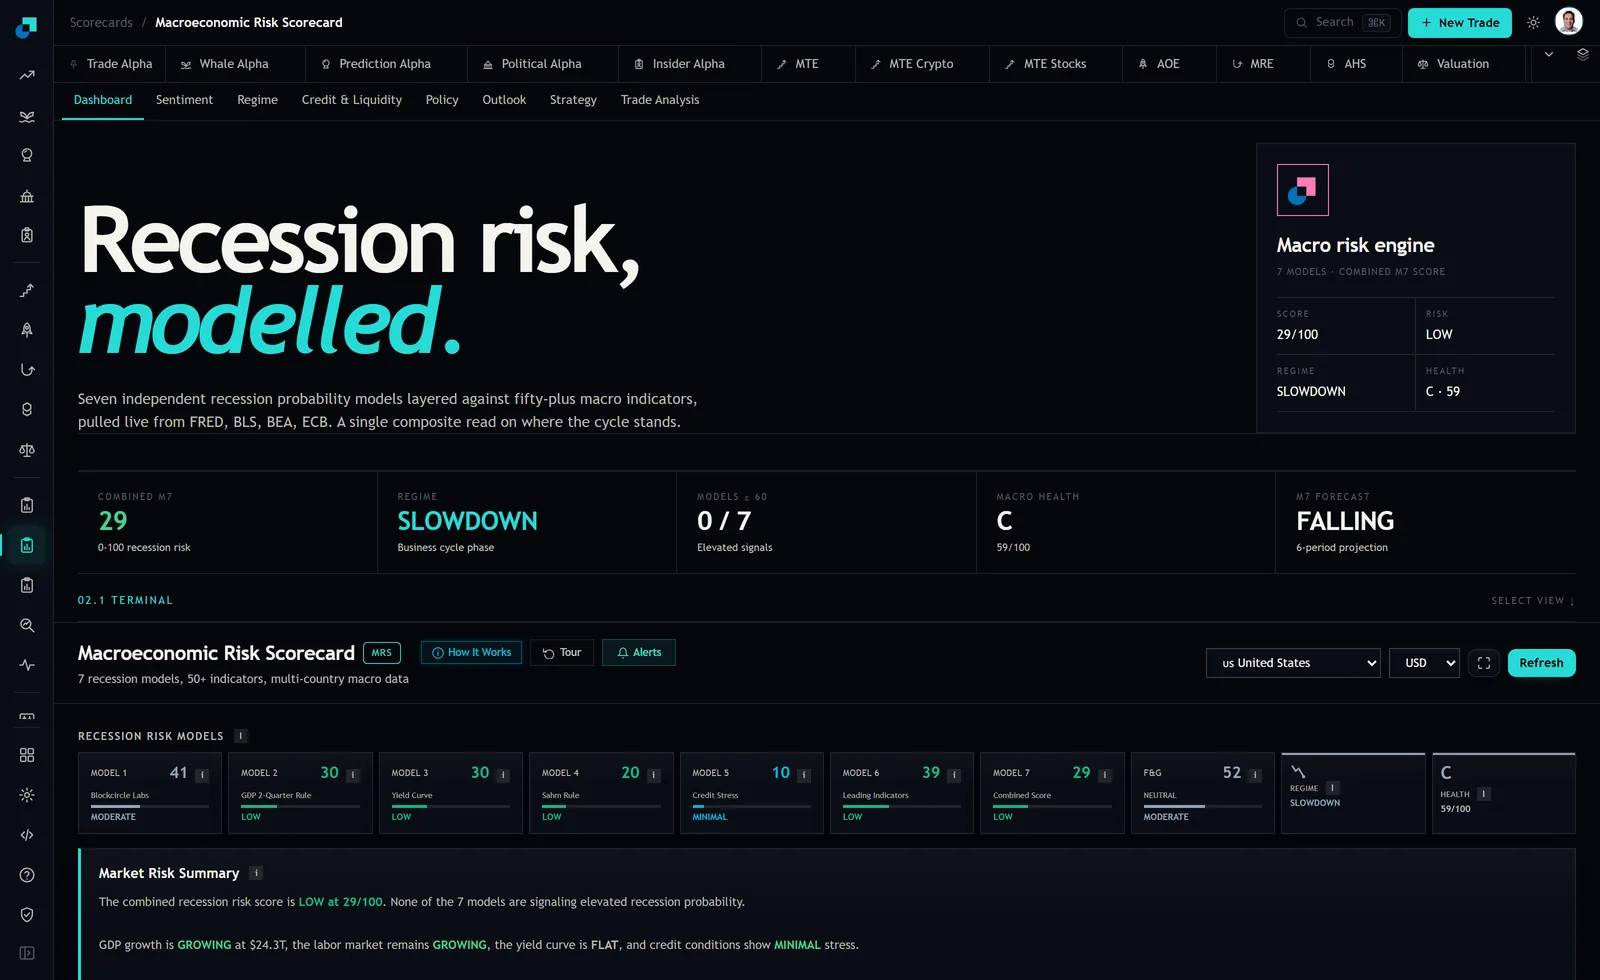
A research note that says "the models are elevated" is not a research note. The question the investment committee will ask, and should ask, is which of the seven moved first, and whether that model has any history of moving first or simply happens to be the loudest today. The Macroeconomic Risk Scorecard runs seven recession probability models with historical accuracy tracking, rolls them into a combined M7 score, and counts how many sit at or above 60. Accuracy and lead time are different properties, and only the first of them comes packaged.
So this is a piece about building the second one yourself, and about why I am not going to hand you a table of months.
Why a published lead time table would not survive scrutiny
Start with the sample. The number of business cycle turning points in the modern macroeconomic data era is small, small enough to count on your fingers, and each model produces exactly one crossing date per episode. That means any lead time estimate per model rests on a handful of observations, and the standard error around a mean of a handful of observations is wide relative to the differences you are trying to rank.
Put concretely: if one model averages nine months of lead and another averages six, across a sample that size, you cannot honestly say the first is earlier. You can say it was earlier in those episodes. Those are different claims and only one of them is defensible when a client asks how you know.
Then add the fact that the episodes are not exchangeable. A cycle turn driven by a policy tightening and one driven by an external shock stress different inputs in different orders. A model that reads credit conditions will look prescient in one and late in the other. Averaging across them produces a number that describes no actual regime.
None of that makes the exercise worthless. It makes the honest output an ordering with wide bands and named episodes, not a league table of months, and a research process that publishes the second while believing the first is setting itself up for a bad conversation.
Order by the family of input, not by measured months
There is a more robust way to rank, and it does not depend on the sample at all. Classify each of the seven by what it consumes, because the timing property is a property of the input, not of the modelling.
Three tiers, and the reasoning for each is structural rather than empirical.
- Expectation carrying. Models built on market prices, the shape of the yield curve, credit default swap levels, high yield spreads. Prices embed a forward view by construction, so these move when the market's expectation changes, which is necessarily before the activity data confirms anything. They are early, and they are also the noisiest, because expectations change for reasons that never materialise.
- Condition describing. Models built on policy settings, the dollar index, money supply, central bank balance sheets. These describe the tightness of the environment rather than an expectation about it. They confirm. They tend to move after prices and before output.
- Activity recording. Models built on realised labour and output series. These describe what has already happened, they arrive with a publication lag on top of that, and they are subject to revision. They are effectively coincident no matter how well they are constructed, because you cannot lead with a measurement of the past.
That ordering is defensible without a single regression, which is exactly what you want in a document that has to survive a compliance read. Placing each of the seven into one of the three tiers is then a matter of recording what each model consumes, which you do once.
The protocol for the in house table
If you want the episode level detail anyway, and there are good reasons to want it, run it like this and keep the output internal.
- Fix the event dates first, before you look at any model output. Use a published, externally maintained set of cycle dates so nobody can accuse you of choosing dates that flatter a model.
- Fix the trigger before you look. A crossing of 60, or a crossing of 50, or two consecutive months above a level. Pick one and apply it to all seven identically. Retrofitting a per model threshold is the most common way this exercise turns into curve fitting.
- Record, per model per episode, the date of first trigger and the gap in months to the event date. Record non triggers as non triggers, not as missing data. A model that stayed quiet through an episode is telling you something and dropping it inflates every remaining number.
- Report the range and the episode names, not the mean. "Triggered between four and eleven months ahead across the episodes we tested, and did not trigger in one" is a sentence you can defend. "Average lead time nine months" is not.
The revision trap that invalidates most of this work
Here is the detail that separates a real evaluation from a plausible one. Much of the underlying data revises. Labour and output series from the BLS and the BEA are restated, sometimes substantially, sometimes for years afterwards. If you run a model over the current, fully revised series, you are asking what the model would have said if it had known things nobody knew at the time.
That produces lead times that are systematically too good, and it flatters the activity based models most, because those are the ones sitting on the most heavily revised inputs. A model can look like it turned three months before the event on revised data and have printed nothing at all on the vintage available that month.
The fix is to evaluate on real time vintages where you can obtain them, and where you cannot, to say so in the note. Not as a caveat buried at the end. As a line in the methodology that states which models were tested on revised data and are therefore not comparable to the ones that were not. Half the value of this exercise to a committee is demonstrating that you know which of your own numbers are soft.
What the ordering is allowed to authorise
The point of establishing tiers is to attach different permissions to each, so that the ordering does work rather than sitting in an appendix.
An expectation carrying model crossing on its own authorises research, not trades. It goes on the agenda, it triggers the deeper look at credit and liquidity, and it starts the clock. It does not move gross exposure, because the false positive rate on forward looking prices is the highest in the set and everyone at the table knows it.
A condition describing model crossing after an expectation model has already crossed is the confirmation, and that combination is what a de-risking mandate should key on. Two tiers agreeing is a materially different evidence state from one tier shouting, and the count of models at or above 60 on the dashboard header is the fastest way to see whether you have it.
An activity recording model crossing authorises nothing at all on its own. By the time realised output and labour data trip a threshold, the market has had the same information for weeks. If your process ever cuts exposure on the basis of a coincident model firing alone, you have built a system that sells after the drawdown, and the ordering exercise exists mostly to stop you doing that.