Two books can post identical annual returns and require completely different risk architectures, because the shape of the losing is different. A trend book and a reversal book are the canonical pair. Most desks know this in the abstract and then set limits for both of them out of the same template, which works until the quarter where it does not.
The distinction is not a matter of degree. It changes which control binds, which statistic is informative, and what you can credibly say to an allocator before rather than after the event.
Two books, two ways of losing money
A trend book loses by attrition. It takes a large number of small losses waiting for a move, and the equity curve spends long stretches drifting downward while nothing is wrong. Its drawdowns are long in duration and moderate in depth, and they end abruptly when a move arrives. The payoff is positively skewed, so the tail that matters is on the winning side.
A reversal book is the mirror. It wins often and modestly, the curve climbs in a way that looks almost administrative, and the losses arrive together. The payoff is negatively skewed, which is the long-standing characterisation of mean-reversion strategies generally, and it means the tail that matters is on the losing side and it is the tail that arrives when a market stops reverting and starts going.
The operational consequence is that the trend book's worst statistic is time and the reversal book's worst statistic is depth. Risk conversations about a trend book are about patience and career risk. Risk conversations about a reversal book are about the week.
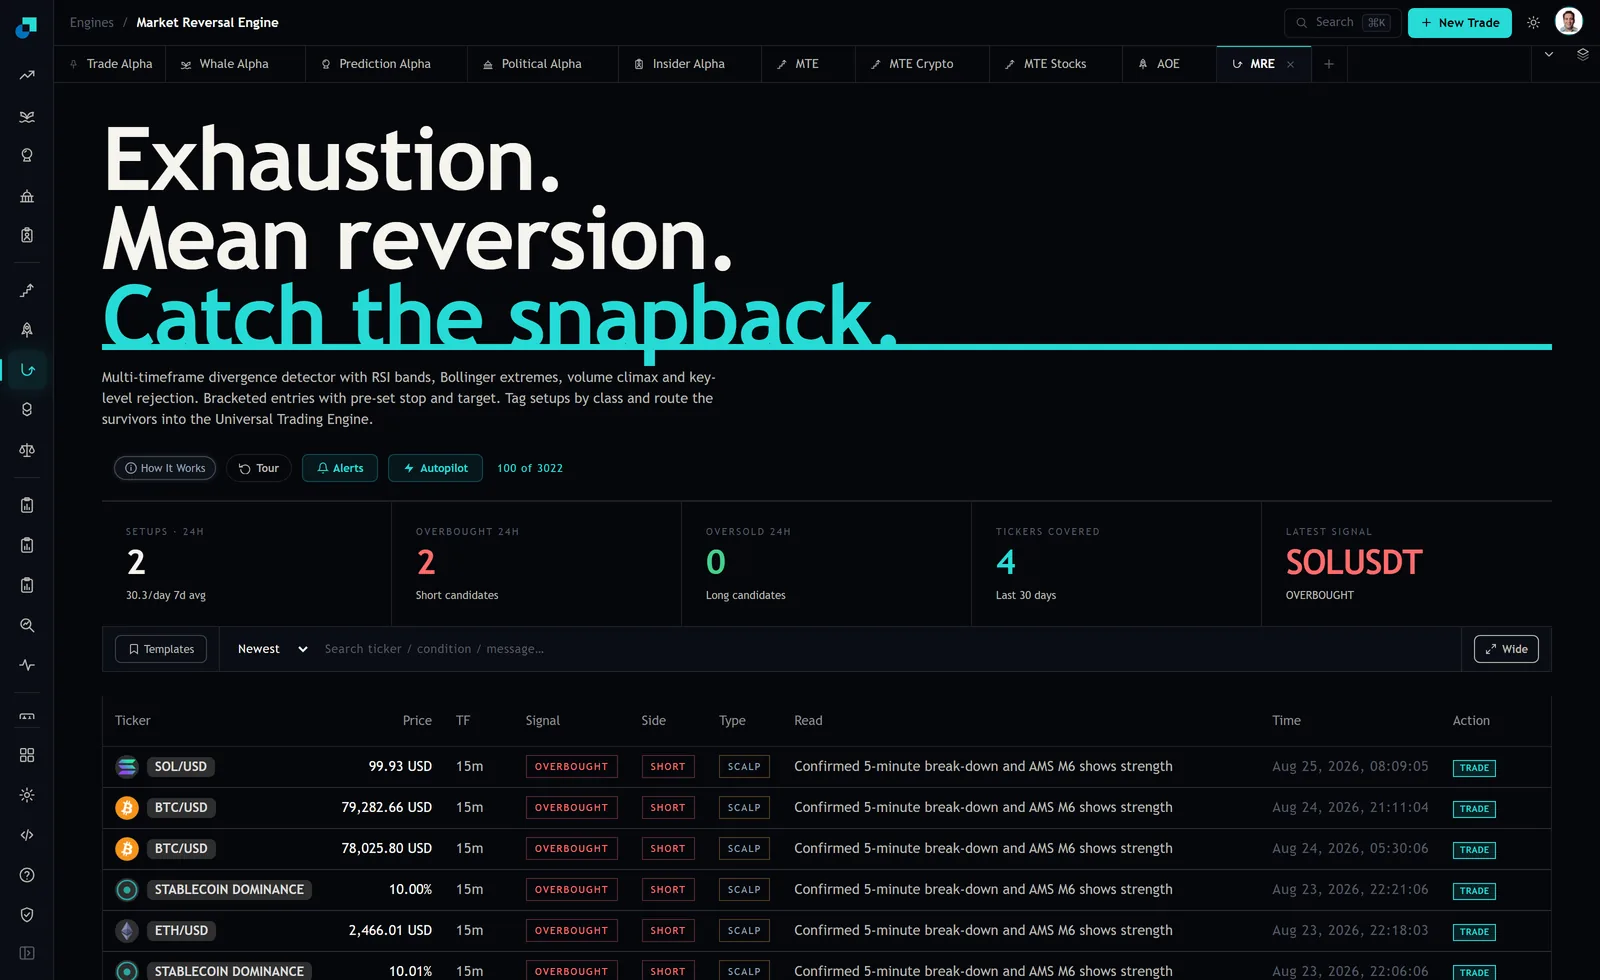
Read the tiles alongside the rows and the mechanism is right there. A reversal engine fires when instruments are stretched, and correlated instruments become stretched together. The capture shows the entire visible feed pointing the same way on the same side. Nothing has gone wrong. That is the engine working, and it is also the reason the book's positions are not independent draws at precisely the moment independence would help.
Why the per-trade stop does not bound the book
Every setup ships with a bracketed entry carrying a pre-set stop and target. At the level of a single position, that bounds the loss, subject to the usual caveat about whether the price actually passes through the stop level while a market is running.
At the level of the book it bounds nothing useful, and this is the specific error worth naming. If a desk sizes each position to risk a fixed fraction and holds n positions, the naive book risk is n times that fraction only under independence. When the feed hands you four correlated shorts on the same directional read, the effective number of independent bets is closer to one, and the realised loss when the regime moves against you is n stops, not one.
The arithmetic is unforgiving. A per-trade risk that looks conservative in isolation, multiplied by the number of simultaneous same-direction positions the engine can produce on a lopsided day, is the number that shows up in the monthly. If nobody has computed that product, the desk does not have a risk limit, it has a per-trade convention.
The second amplifier is signal arrival. The setups tile read 2 in the last 24 hours against a 7 day average of 30.3 per day. Whatever the reconciliation between those two figures turns out to be, they establish that arrival is uneven rather than smooth, and uneven arrival means position count is itself a volatile quantity. A book that is comfortable at typical concurrency can be well outside its intended risk on a heavy day without any parameter having changed.
The drawdown belongs on a calendar, not an equity curve
Equity curves flatter negatively skewed strategies. Plot a reversal book and the eye sees a clean line with an occasional notch, which is technically an accurate rendering and practically a misleading one.
Two views tell the truth better. The first is a histogram of daily results, where the reversal book shows a tight cluster of modest positive days and a small number of days far to the left, and the trend book shows the opposite. The second is a table of the largest single-day and single-week losses next to the median winning day. That ratio, largest loss over median win, is the number that tells a risk committee how many good days one bad day consumes, and it is the number a reversal desk should be able to quote from memory.
The recovery path also differs and it deserves explicit modelling. A trend book recovers in a jump because the same mechanism that caused the drawdown eventually produces the move. A reversal book recovers by grinding, one modest win at a time, which means recovery duration scales with the depth of the hole rather than with the arrival of a single event. If your drawdown policy includes de-risking after a threshold, note that de-risking a grinding recovery extends it mechanically, and decide in advance whether you accept that.
Limits that bind on the thing that actually breaks
Three limits do the work here, and only one of them is the one most templates contain.
A net directional exposure cap, stated across the correlated group rather than per instrument. When BTC, ETH and SOL are all short, that is one exposure, and the limit should be expressed against the group so that adding the third position consumes the same budget rather than opening a new one.
A concurrency cap on same-direction positions, which is a blunt instrument and the right one. It is the control that keeps a lopsided day from silently tripling the book's risk, and unlike a correlation-based measure it cannot be argued with in the moment.
And a loss-cluster trigger measured over a short rolling window rather than over the month. Because the losses arrive together, a monthly limit is a control that reports the damage rather than one that limits it. The window has to be short enough to catch a cluster while it is still forming.
Note what is missing from that list. A volatility target estimated from the book's own recent return series will understate risk on a reversal book, for the same reason the equity curve flatters it: the historical sample is dominated by the quiet regime and the tail is under-represented until it is not. Use it if you must, but do not let it be the binding constraint.
The paragraph you write before the quarter you need it
Reporting is where negative skew does the most reputational damage, and the mechanism is simple. For an extended period the book produces a high hit rate and a smooth line, and everyone who reads the letter forms an expectation from it. Then the shape asserts itself.
So report the pair, always. Hit rate next to average win over average loss, in the same sentence, from the first letter onward. A hit rate quoted alone is not a partial description of a reversal book, it is a misleading one, and the fact that it is technically accurate is exactly why it is dangerous.
Then write the expectation paragraph while things are calm. State that the strategy is designed to produce frequent modest gains and infrequent larger losses, that its losing periods are expected to be short and steep rather than long and shallow, and that positions will at times be concentrated in one direction across correlated instruments because that is what the signal generation does. Put a number on the largest loss the current limits permit.
An allocator who has read that paragraph in three consecutive good quarters reads the bad one as the strategy behaving as described. An allocator meeting it for the first time in the drawdown letter reads it as an excuse, and they are not wrong to.