Risk systems are built to answer questions about positions. How much of the book is in one name, one sector, one factor, one counterparty. They are not built to answer the question that actually determines whether an event contract strategy exists next quarter, which is how much of your investable universe is manufactured by a single operator.
That is a supplier concentration rather than a position concentration, and it does not show up anywhere in a standard exposure report. A fund can be beautifully diversified across forty questions in six categories and still be running a strategy where one company decides what gets listed, what the resolution criteria say, and whether the venue is up on the day a position needs to be exited.
The measurement already exists on the stats tab
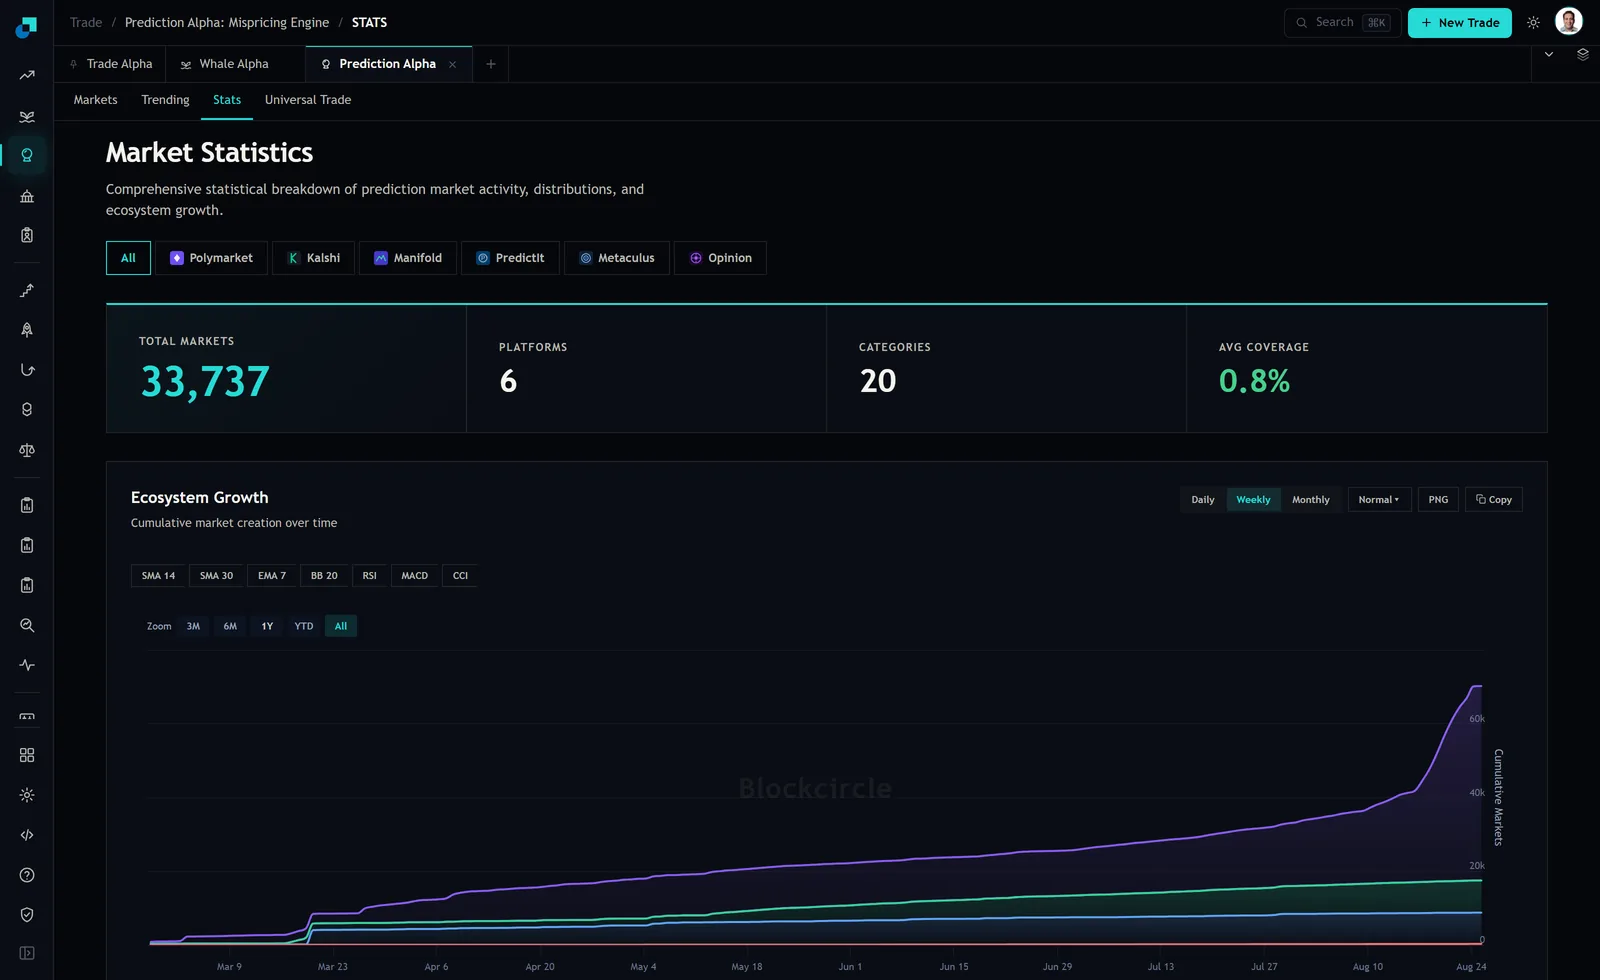
Prediction Alpha's stats tab carries a chart called Ecosystem Growth, described on the page as cumulative market creation over time. It buckets daily, weekly or monthly, zooms from three months to all history, and the accessibility description on it calls it a combination chart with seven data series against a Cumulative Markets axis. Above the chart sits a platform selector listing all six venues individually.
Seven series against six venues plus a total is the shape you want. It means the split you need is not an analysis project, it is a chart already drawn, and the export controls next to it will hand you a copy for the file. Most of the work of measuring supplier concentration in this asset class has been done for you and left sitting on a tab most desks open once.
Read the shares off the endpoints, and pin the denominator first
Reading the visible endpoints off the axis in the capture above: the top series finishes a little above 66,000, the second near 17,000, the third near 8,000, and the remainder are indistinguishable from zero at this zoom. That puts the leading operator at roughly 70 percent of all cumulative listings and the top two at something close to 90 percent.
Before that number goes into a limit document, deal with the denominator problem, because this module gives you three different counts of the same thing. The stats tab's own Total Markets tile reads 33,737. The markets tab reports 56.2K markets indexed across six venues. And the top series of this chart, alone, ends above 60,000. Those are not errors, they are three definitions: cumulative creation including everything already resolved, an indexed universe after whatever filtering the ingest applies, and a tile with its own scope.
A concentration limit written against an unpinned denominator is unenforceable, because the next person to compute it will get a different answer and neither of you will be able to say who is wrong. Pick one definition, write it into the limit, and recompute it the same way every month. Cumulative creation is the right choice for measuring supplier dependence, because it captures the operator's role as the manufacturer of the universe regardless of what is currently live.
Creation share is not exposure share
A 70 percent share of listings would be alarming enough on its own. It is also the wrong metric, and reading it as your exposure will understate the problem rather than overstate it.
Listing count treats a resolved esports fixture and a multi million dollar political question as one unit each. What your book depends on is tradable notional, and turnover is more concentrated than creation, not less. On the trending tab of the same module, every one of the ten rows on the highest 24 hour volume board carries the same venue mark, and every one of the ten rows on the most liquid board carries a different single venue mark. On that reading, creation is roughly 70 percent concentrated and same day turnover was effectively total on one venue at the top of the distribution.
So compute two shares and report both. Creation share tells you who manufactures your opportunity set. Notional share, computed from the volume and liquidity fields on the markets you would actually admit, tells you who holds your money. The gap between them is the amount by which a listing count flatters your diversification.
The limit that binds on something you control
You cannot cap venue exposure the way you cap issuer exposure, because there is no substitute venue for most questions. The stats tab's own average coverage figure of 0.8 percent says as much: the overwhelming majority of markets exist in exactly one place. A limit that says no more than 40 percent at any operator simply forbids the strategy rather than shaping it, and a limit everyone knows is unworkable gets waived until it means nothing.
Bind on three things you do control instead. First, collateral resident at one venue, expressed in dollars rather than percent, because this is a direct credit exposure to an operator that holds your money from entry to resolution. Second, open risk that cannot be exited without that specific operator being reachable, which is the number that matters during an outage. Third, the share of positions whose resolution is adjudicated under one operator's rulebook, which is the exposure that survives even if you exit everything.
To size the first of those, ask the question that actually gets answered in a bad week. Venue failure in this asset class rarely looks like a liquidation. It looks like a freeze, so the honest test is how much capital you can afford to lose access to for the length of the longest resolution you are holding. If your longest position runs to January 2027, that is the horizon on the answer, not thirty days.
The cadence, and the trigger that should not wait for it
Re-read the split monthly, export the series, and store it with the date. Three months of stored endpoints is enough to see whether concentration is drifting, and drift is the thing a single reading cannot show you.
The steep segment in the capture is the reason the monthly cadence is not sufficient on its own. A series that adds roughly 26,000 cumulative listings in about ten days, after months of a gentle slope, is not organic growth in demand. It is a listing programme, a venue integration, an ingest change, or a change in what counts as a market. Each of those has a completely different implication for your universe, and a re-weighting done before you know which one it was is a guess dressed up as a process.
So put a trigger on slope rather than on the calendar. Any venue series that changes gradient by more than a stated multiple inside one bucket forces the venue review out of cycle, and the review starts by establishing what the new listings actually are before it touches an allocation. The desks that get hurt here will not be the ones that measured concentration too rarely. They will be the ones that measured it, watched it jump, and treated a data change as a market event.