The whole appeal of running a profile is that you stop looking at it. That is also the failure mode, because the gap between not looking and not knowing is about three weeks, and the first thing you notice after three weeks is usually a number in your account rather than anything on a screen. So the check has to be short enough that you actually do it. Ten minutes, same day each week, four readings and two lines written down.
What follows is not a performance review. A week of trading tells you close to nothing about whether a strategy works, and treating the weekly check as a scoreboard is how people end up switching off a decent profile after a bad Tuesday. The check is an operational one. It asks whether the machine is doing the thing it was configured to do, and whether anything has changed that you did not change.
Minutes one to three, count what it did
Open the History tab and count the trades since your last check. That single number, the fire rate, is the most informative thing you will read all week, and you can only read it if you know what to expect. So the first time you do this, write your expectation down: a profile following a daily signal might reasonably produce zero to three trades a week, one on a four hour clock rather more. Without that written expectation you have a count with nothing to compare it to.
Then open Open Positions and count what is sitting there right now, along with the instrument and direction of each. Do not evaluate them. You are checking that every open position is something this profile is supposed to be able to hold. An instrument you do not recognise, or a short when you thought the profile was long only, is not a bad trade. It is a configuration that is not what you believe it to be, and that is a much bigger problem than a losing position.
Minutes four to six, the guardrails and what they stopped
Autopilot describes itself as running risk guards, trailing stops and partial take profits, and the ones you set are doing work on your behalf every week whether or not you look at them. The question for the weekly check is not whether they are on. It is how often they bound.
A guardrail that has never bound has told you nothing. It might be set correctly or it might be set at a level so loose it will never trigger before your account has taken damage, and from the outside those look identical. So the first time a cap actually stops something, that is good news and worth a line in the log, because you have just learned that the control is real and connected.
The reading that should bother you is the opposite one, a cap binding repeatedly. If the exposure ceiling or the concurrent position limit is being hit most weeks, then the cap has stopped being a safety net and has quietly become your position sizer. Every trade the profile wanted to take that got trimmed or skipped is a difference between what you are running and what you thought you were running, and the trades that get cut are not a random sample. They are whichever ones happened to arrive when you were already full, which is often a cluster in one direction, which is often the move you actually wanted.
The fix is not to loosen the cap. It is to decide, deliberately and in the log, whether you would rather trade fewer instruments at the size you intended or all of them at a smaller size.
Minutes seven to nine, drift from what the backtest said
Three comparisons, none of which involve profit. Take them from the Backtest and Analytics tabs and from your own notes when you set the profile up.
The first is trade frequency. If the backtest implied roughly two signals a week and you are getting six, the live profile is trading something the backtest was not, and the usual causes are dull ones: a broader instrument list, a looser filter, or a duplicate signal source firing the same idea twice. Six trades a week where you expected two is also six lots of fees where you expected two, which at retail size is not a rounding error.
The second is hold time. If the backtest held positions for days and yours are closing within hours, a stop or a trailing stop is doing the exiting rather than the strategy. That is not automatically wrong, but it means the thing you are running is your stop, not the signal.
The third is instrument mix. Count which instruments actually traded this week and compare that list to what you expected. Concentration turns up here first, usually because one instrument is generating most of the signals, and one instrument generating most of the signals is one instrument generating most of the risk.
Nine minutes in, none of this has required an opinion about whether the strategy is any good, which is the point. You do not have enough data for that opinion and you will not for months.
Three readings that mean switch it off today
Most weeks the check ends with a shrug and a log entry. These three end it differently, and the response to each is to disable the profile the same day and investigate afterwards rather than the other way around.
A position you cannot account for. An instrument outside the list, a direction the profile should not take, or a size noticeably larger than the profile's own rules should allow. Any of those means the configuration in the engine is not the configuration in your head, and until you know which is right, everything else the profile does is uninterpretable.
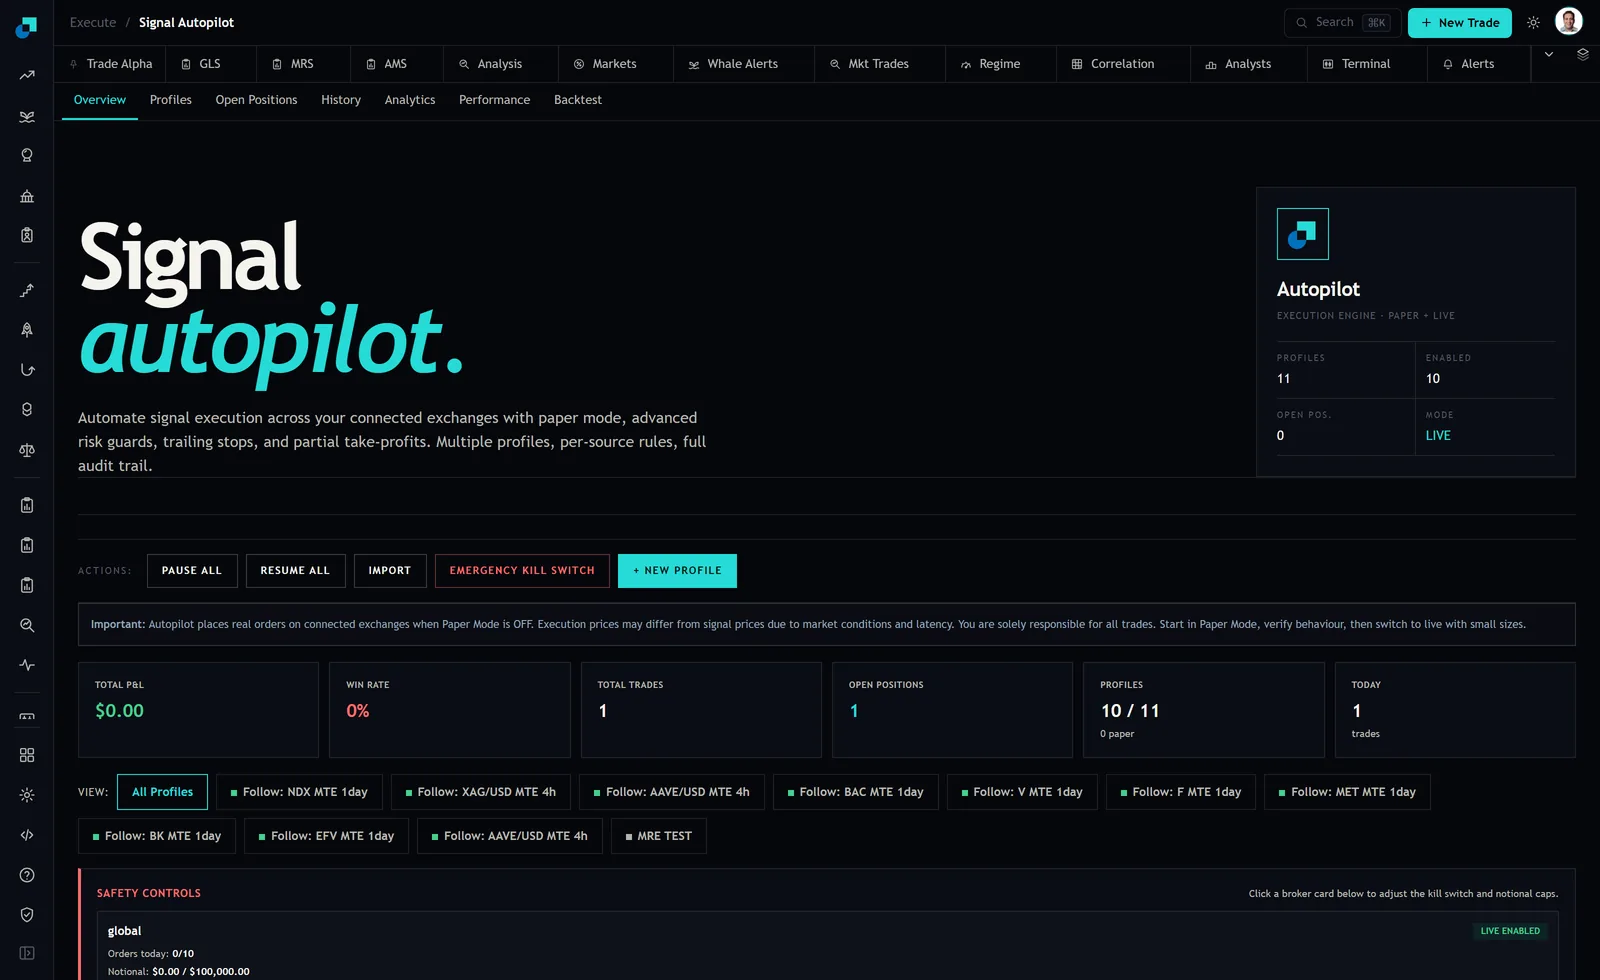
The platform and your account disagree. Compare the open positions the module shows against what your connected exchange or broker account actually holds. If those two counts differ, and you have not just placed something manually, stop. A supervision routine that reads from a book which does not match reality is worse than no routine, because it produces confidence. The header disagreement in the screenshot above is the mild version of this. The serious version is a position at the venue that the engine does not think exists, which means nothing in the engine is going to close it.
A fire rate far above expectation, especially on one instrument. Eleven trades in a week from a profile that should produce two, or the same instrument traded four times in a day, is the shape of a signal loop or a duplicated feed. This one costs money fastest, because every repetition pays the spread and the fee again, and it can drain a small account in days while every individual trade looks reasonable.
One practical note on switching off. Disabling a profile and closing what it already holds are two different actions, and the first does not perform the second. If you disable a profile that has open positions, decide immediately whether those positions are now yours to manage by hand, because a stop that lived inside the profile may no longer be watching them. Work out which way your setup behaves before you need to know, ideally in paper, and not on the afternoon you are trying to shut something down.
The last minute, which is the one that compounds
Write two lines. The date and the four readings, then anything that was different from last week. That is the entire log and it takes sixty seconds.
Its value is not this week, it is in three months, when you are trying to work out when a profile started behaving differently. Without the log you will have a vague sense that things changed around the time the market got choppy. With it you will have the week the fire rate doubled, and probably the reason, because you will also have written down that you added an instrument the previous Sunday. Almost every strange behaviour I have chased down in an automated profile turned out to have started with a change I made and forgot, and the log is what turns that from an archaeology project into a thirty second lookup.