
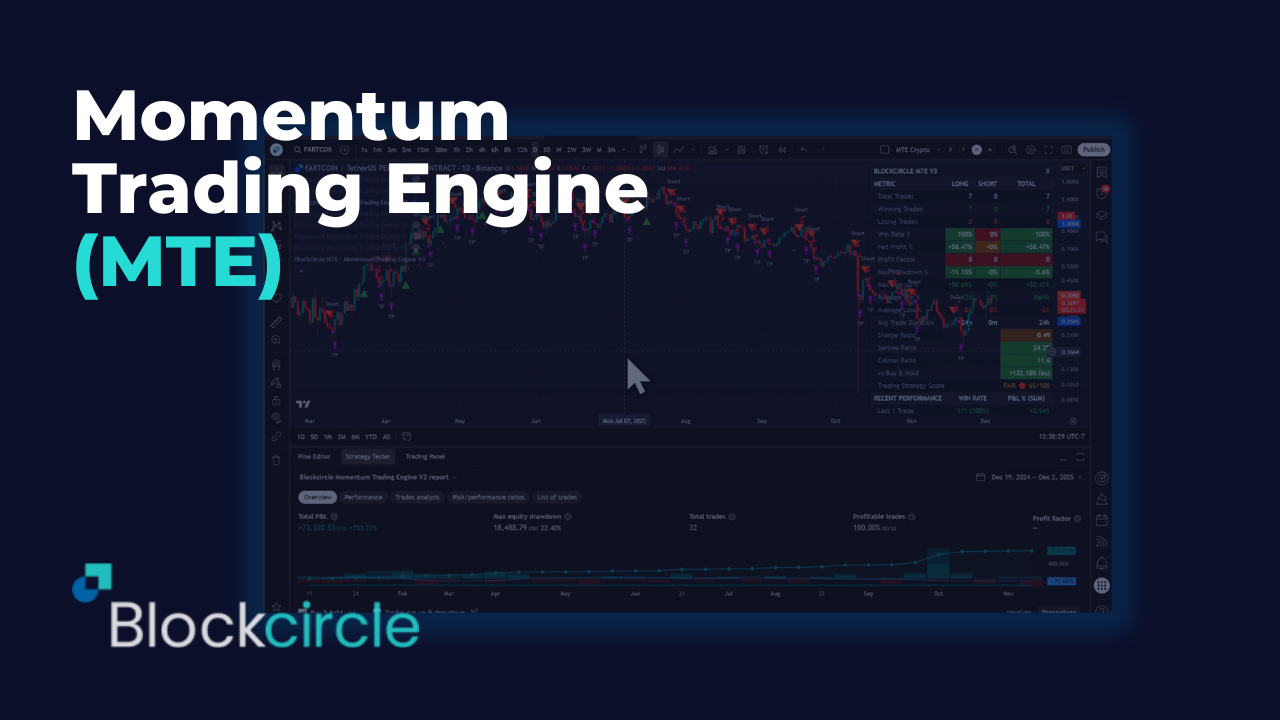
COMPLETE SETUP & CONFIGURATION MANUAL
PREREQUISITES & INITIAL SETUP
Before beginning, ensure you have:
- A TradingView account (minimum Essential, preferably Plus+)
- Active Blockcircle subscription
Account Integration Process
- TradingView Account Creation -> Navigate to TradingView.com and create your account. Choose a username carefully as this will be permanent and case-sensitive. Write down your exact username, including any numbers, underscores, or capital letters. For example, if you register as “Blockcircle_Trader1234”, this exact format must be used everywhere.
- Blockcircle Integration Visit blockcircle.com/account and enter your TradingView username exactly as registered. The system performs case-sensitive matching – “Blockcircle_Trader1234” will not match “blockcircle_trader1234”. After entering your username, you’ll receive access to the MTE V3.
- Accessing Your Trading Chart -> Once logged into TradingView, click “Chart” in the top navigation menu. You’ll see a default chart appear. To change the trading pair, click the symbol in the top-left corner (usually showing “AAPL” or another default). Type your desired pair such as “BTCUSDT” and select the appropriate exchange (BINANCE, COINBASE, KRAKEN, etc.). The exchange choice matters as prices can vary slightly between exchanges and each trading pair represents a unique order book!
- Timeframe Selection Above the chart, you’ll see timeframe options (1m, 5m, 15m, 1h, 4h, D, W, M), depending on what trading strategy you are setting up, you might need to setup a custom time interval by clicking Custom at the bottom. Your timeframe selection fundamentally changes your strategy:
- 1-15 minutes: Day trading and scalping
- 1-4 hours: Swing trading
- Daily/Weekly: Position trading
- Monthly: Long-term investment analysis
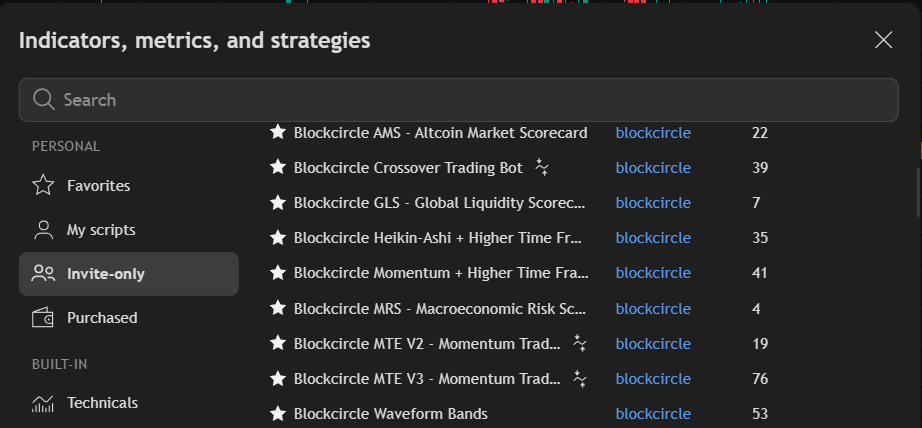
- Adding MTE V3 to Your Chart Click the “Indicators” button (looks like ƒx) at the top of your chart. In the search window that appears, navigate to the “Invite-Only” tab. You should see “Blockcircle MTE V3 – Momentum Trading Engine” if your account has been granted access. Click on it once to add it to your chart.
SECTION-BY-SECTION DETAILED CONFIGURATION
SECTION 1.0 – STRATEGY CONFIGURATION & METRICS
Configuration Name – This field allows you to label your specific strategy setup. Be descriptive and include key parameters. Instead of “X”, use names like “C 19” for CONFIGURATION 19 or “C 21” for CONFIGURATION 21. This helps when managing multiple configurations and comparing performance.
Strategy Notes A text area for documenting your configuration logic. Include:
- Why you chose specific indicators
- Market conditions this strategy targets or target trading goals
- Any special considerations or observations
- Date created and last modified
These notes appear in your alerts, helping you remember the strategy context when receiving signals.
Show Configuration Table When enabled, displays a comprehensive performance scorecard on your chart showing:
- Total trades executed
- Win rate percentages
- Profit factor
- Sharpe and Sortino ratios
- Maximum drawdown
- Average trade duration
- Recent performance metrics
Keep this enabled during backtesting, disable for cleaner charts when live trading.
Table Position – Choose where the performance table appears on your chart. “Top Right” is standard, but if you have other indicators displaying information, you might prefer “Bottom Right” or “Middle Left” to avoid overlap.
Show Extended Metrics Enables – additional performance calculations not shown in TradingView’s standard strategy tester:
- Calmar ratio (annual return / max drawdown)
- Separate long/short performance
- Time-based performance breakdown
- Quality score (0-100 rating)
Table Font Size Adjusts readability based on your screen size and resolution. Start with “Small” and adjust as needed.
SECTION 1.1 – BACKTESTING PERIOD
Define Start and End Date – Critical for accurate backtesting. Always enable this to ensure consistent test periods. Without it, the strategy uses all available historical data, which varies by symbol and timeframe.
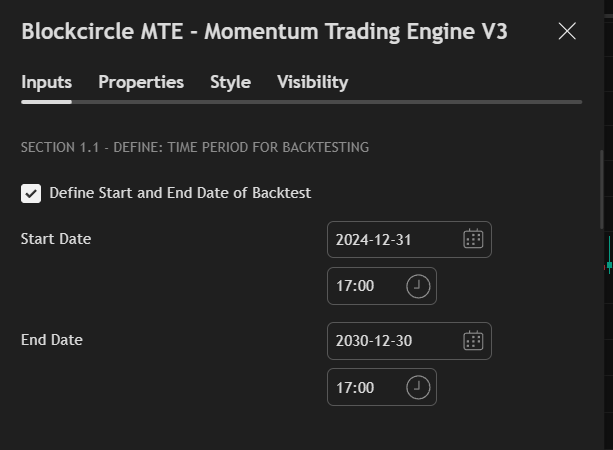
Start Date – Choose based on the market cycle you want to test:
- Bull market test: Start January 2021
- Bear market test: Start January 2022
- Full cycle: Start January 2020
- Recent performance: Start 6 months ago
End Date – Typically set to a future date (2030) to include all data up to today. Only set a past date if testing a specific historical period.
SECTION 2.0 – ALTCOIN MARKET SCORECARD (AMS)
The AMS is MTE’s proprietary market sentiment analyzer, tracking 11 different metrics to gauge overall crypto market health. Think of it as a “weather report” for crypto markets.
Understanding the AMS The scorecard analyzes relationships between different market components:
- Bitcoin dominance trends
- Altcoin performance relative to Bitcoin
- Stablecoin flows
- Traditional market correlations
- Market capitalization shifts
Each metric receives a score, combined into a 0-100 overall score:
- 80-100: Very Bullish (strong uptrend conditions)
- 60-80: Bullish (favorable for longs)
- 40-60: Neutral (choppy, uncertain)
- 20-40: Bearish (favorable for shorts)
- 0-20: Very Bearish (strong downtrend)
Enable Altcoin Market Scorecard Master switch for the entire AMS system. When enabled, the strategy considers overall market conditions before entering trades. This helps avoid fighting the broader market trend.
Sector Beacon Symbol (M2) Customize which asset represents your sector of interest:
- ETHBTC: General altcoin health (default)
- SOLBTC: High-beta altcoin momentum
- DOGEBTC: Retail sentiment indicator
- LINKBTC: DeFi sector health
Use Current Candle When enabled, uses real-time unfinished candle data for faster signals but potentially more false positives. When disabled, waits for candle close for confirmed signals but with slight delay.
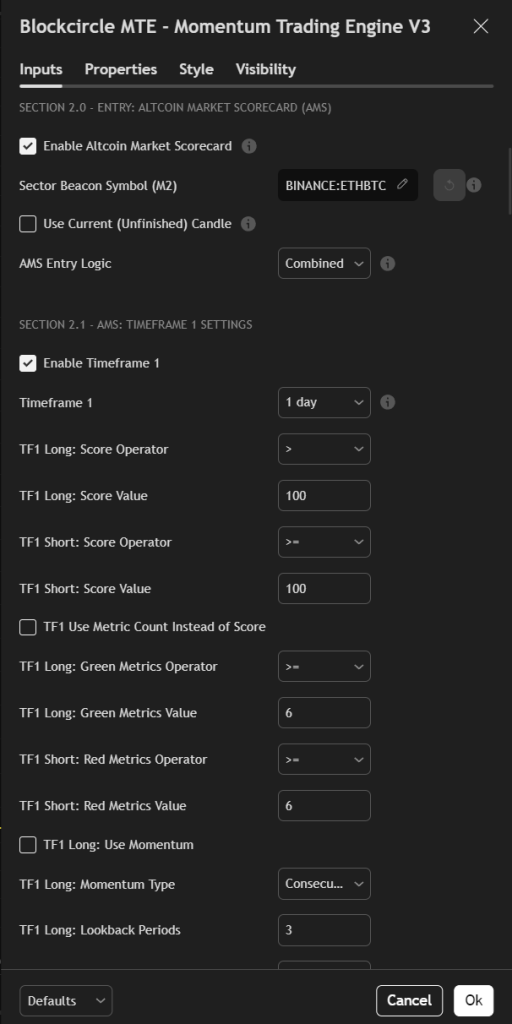
AMS Entry Logic Controls how multiple timeframes interact:
- Combined: Both timeframes must agree (most conservative)
- TF1 Only: Uses only first timeframe (faster signals)
- TF2 Only: Uses only second timeframe (slower, more reliable)
- Any TF: Either timeframe can trigger (most aggressive)
Enable Time Window Allows the AMS condition to be true if it was valid within the past X bars, not just currently. Useful for catching entries after the initial signal.
SECTION 2.1 & 2.2 – AMS TIMEFRAME SETTINGS
Timeframe Selection – Each timeframe provides different perspective:
- 5-15 minutes: Micro market structure
- 1-4 hours: Intraday sentiment
- Daily: Short-term trend
- Weekly: Long-term trend
Common combinations:
- Scalping: 15m + 1H
- Day Trading: 1H + 4H
- Swing Trading: 4H + Daily
- Position Trading: Daily + Weekly
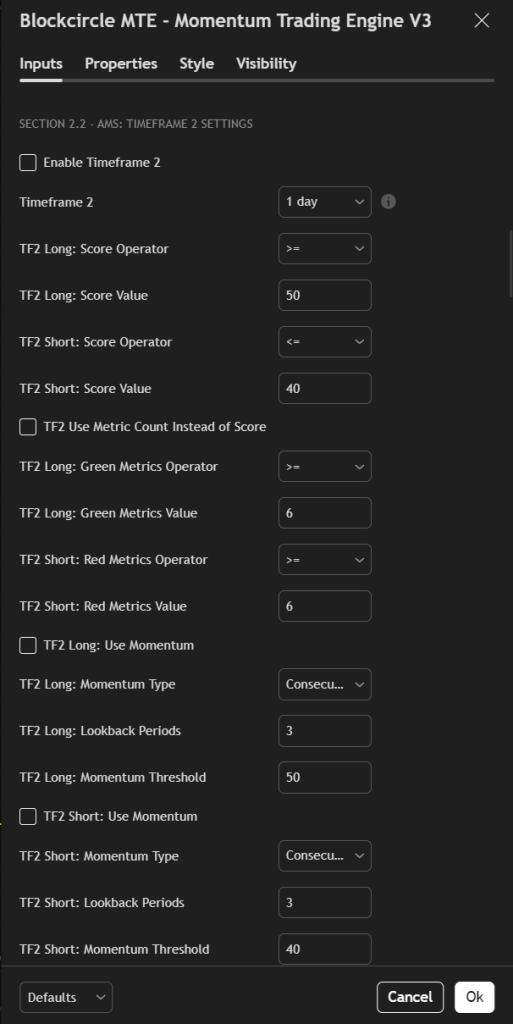
Score vs Metric Count Two ways to evaluate market conditions:
Score-based (default): Uses the weighted 0-100 score. More nuanced but requires understanding score ranges.
Metric count: Simply counts how many metrics are green (bullish) or red (bearish). Easier to understand but less precise. If 7 of 11 metrics are green, market is generally bullish.
Momentum Conditions Advanced feature tracking score changes over time:
- Consecutive Above: Score stayed above threshold for X periods
- Increasing: Score trending higher
- Was Above Now Below: Reversal signal
- Hit Level Twice: Retesting important levels
Use momentum to avoid entering during score transitions and wait for stable conditions.
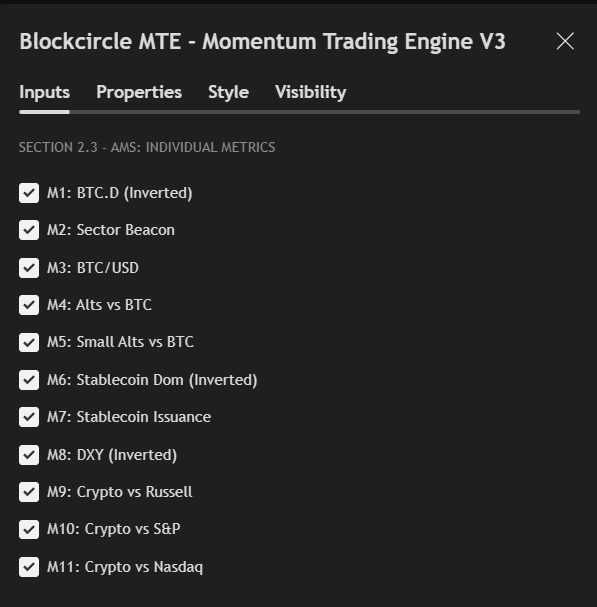
SECTION 2.3 – INDIVIDUAL METRICS CONTROL
Each metric can be individually enabled/disabled to customize your market analysis:
- M1: BTC.D (Bitcoin Dominance) – Inverted When Bitcoin dominance decreases, altcoins typically outperform. This metric is inverted so green means good for altcoins.
- M2: Sector Beacon Your chosen sector representative (ETH, SOL, etc.) versus Bitcoin. Green when outperforming Bitcoin.
- M3: BTC/USD Bitcoin’s absolute price trend. Often leads the entire crypto market.
- M4: Alts vs BTC Total altcoin market cap versus Bitcoin. Measures broad altcoin strength.
- M5: Small Alts vs BTC Smaller altcoins often move last but most dramatically in cycles.
- M6: Stablecoin Dominance – Inverted High stablecoin dominance means money sitting on sidelines. Lower is bullish (hence inverted).
- M7: Stablecoin Issuance New stablecoin minting indicates fresh capital entering crypto.
- M8: DXY (Dollar Index) – Inverted Crypto often moves opposite to US Dollar strength.
- M9-M11: Traditional Market Correlations Crypto’s performance versus Russell 2000, S&P 500, and Nasdaq. Positive correlation suggests risk-on environment.
SECTION 2.4 – BLOCKCIRCLE MOMENTUM CONDITIONS
The Blockcircle Momentum rule is based upon the Commodity Channel Index with advanced smoothing to identify momentum shifts with minimal lag and other tweaks to identify trend direction.
Understanding Momentum Trading Momentum strategies capitalize on the tendency of trending assets to continue trending. The identifies when momentum is accelerating or decelerating, providing early entry and exit signals.
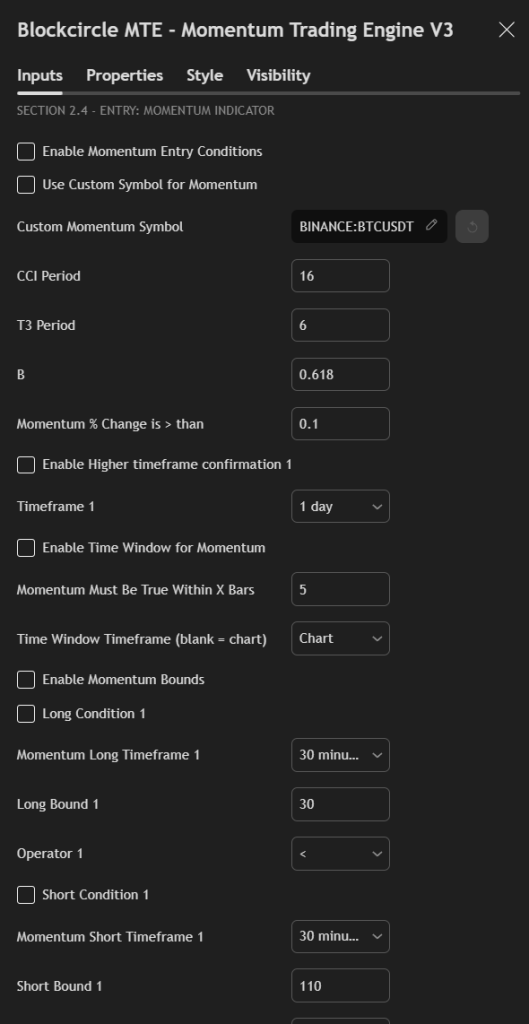
Enable Momentum Entry – Activates the core momentum calculations. Even when disabled, you can still use momentum bounds conditions below.
Use Custom Symbol – Allows momentum calculations on a different asset. Example: Use Bitcoin momentum to trade altcoins, as BTC often leads market moves.
CCI Period – (default: 16) The lookback period for the Commodity Channel Index:
- Lower values (8-14): More sensitive, more signals, more false positives
- Standard (14-20): Balanced approach
- Higher values (20-30): Fewer but higher quality signals
T3 Period – (default: 6) Smoothing factor for the T3 calculation:
- Lower values (4-6): Faster response, slight lag
- Higher values (8-12): Smoother signals, more lag
B Factor – (default: 0.618) Volume factor based on Fibonacci ratio. Rarely needs adjustment. Controls the T3 smoothing characteristics.
Momentum % Change – Minimum percentage change required between candles to trigger signal. Start with 0.1% and adjust based on asset volatility:
- Stable assets (BTC): 0.05-0.15%
- Volatile assets (small caps): 0.2-0.5%
Higher Timeframe Confirmation – Requires momentum agreement on a higher timeframe. Reduces false signals but may delay entries. Common settings:
- If trading 1H, confirm on 4H
- If trading 4H, confirm on Daily
- If trading Daily, confirm on Weekly
Enable Momentum Bounds – Advanced feature checking if momentum is within specific ranges, not just direction. Useful for:
- Avoiding overbought/oversold extremes
- Trading momentum revivals from oversold
- Catching momentum exhaustion
Long/Short Conditions Set specific momentum levels for entry:
- Long when momentum < 30: Oversold bounce trades
- Short when momentum > 110: Overbought exhaustion
- Increasing/Decreasing trend: Momentum acceleration patterns
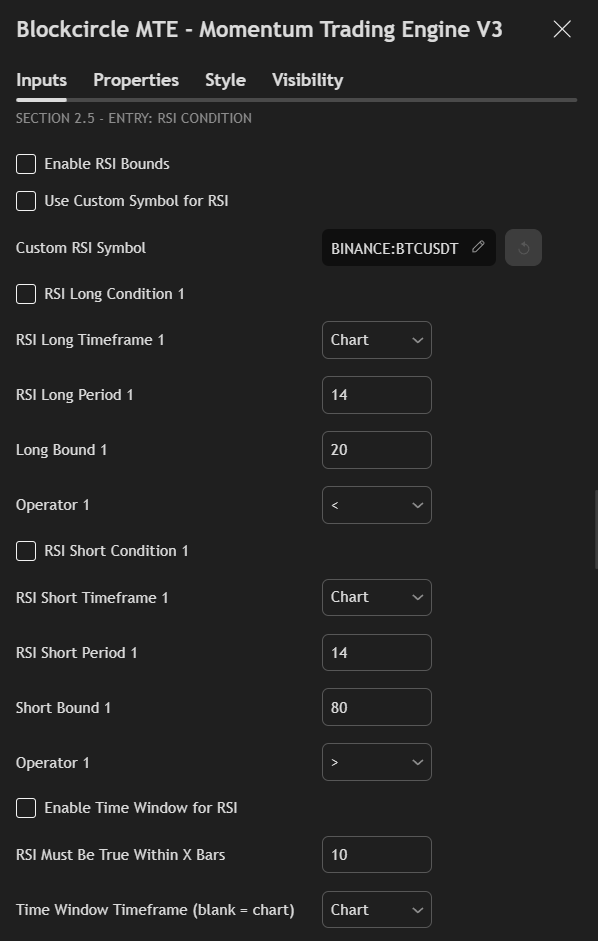
SECTION 2.5 – RSI CONDITIONS
The Relative Strength Index measures momentum through price change velocity. Unlike standard RSI strategies that only buy oversold, MTE allows complex RSI conditions.
Understanding RSI Ranges
- 0-30: Oversold (potential bounce)
- 30-50: Bearish momentum
- 50-70: Bullish momentum
- 70-100: Overbought (potential reversal)
Enable RSI Bounds – Activates RSI-based entry conditions. Can be used alone or combined with other indicators.
Custom Symbol Option Trade – one asset based on another’s RSI. Example: Buy ETH when BTC RSI is oversold, as BTC often leads market recoveries.
Timeframe Selection RSI behavior varies by timeframe:
- Hourly: Many extreme readings, quick reversals
- Daily: More reliable signals, fewer occurrences
- Weekly: Major trend reversal points only
RSI Period – (default: 14)
- Shorter periods (7-10): More sensitive, reaches extremes frequently
- Standard (14): Balanced for most strategies
- Longer periods (20-30): Smoother, fewer but stronger signals
Bound Values and Operators Instead of fixed “buy at 30, sell at 70”, MTE allows flexible conditions:
- Long when RSI < 25: Deep oversold only
- Long when RSI > 50: Momentum confirmation
- Short when RSI < 70: Early trend exhaustion
Time Window Functionality “RSI was oversold within past 10 bars” instead of “RSI is oversold now”. Catches rebounds after extreme readings.
SECTION 2.6 – SLOW STOCHASTIC INDICATOR
The Slow Stochastic oscillator identifies overbought/oversold conditions through price position within recent range.
How Stochastic Differs from RSI While RSI measures momentum, Stochastic measures price location within range. It’s more sensitive to support/resistance levels.
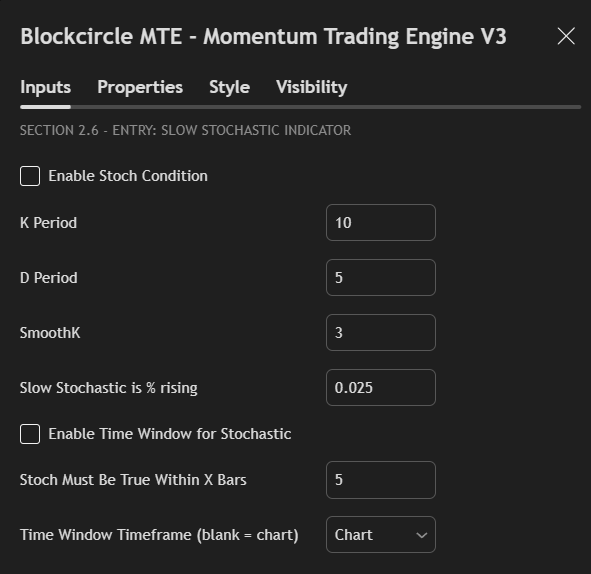
K Period (default: 10) Main lookback period. Lower values increase sensitivity.
D Period (default: 5) Signal line smoothing. Creates the “slow” in Slow Stochastic.
SmoothK (default: 3) Additional smoothing for K line. Reduces whipsaws.
Percentage Rising/Falling Minimum change required to confirm direction. Prevents signals from minor fluctuations. Start with 0.025% (2.5 basis points).
Effective Combinations
- Stochastic + RSI: Confirms oversold/overbought
- Stochastic + Momentum: Trend confirmation
- Stochastic + Price Levels: Support/resistance validation
SECTION 2.7 – FLEXIBLE INDICATOR FRAMEWORK
This powerful module provides access to 10+ additional technical indicators, each with customizable parameters.
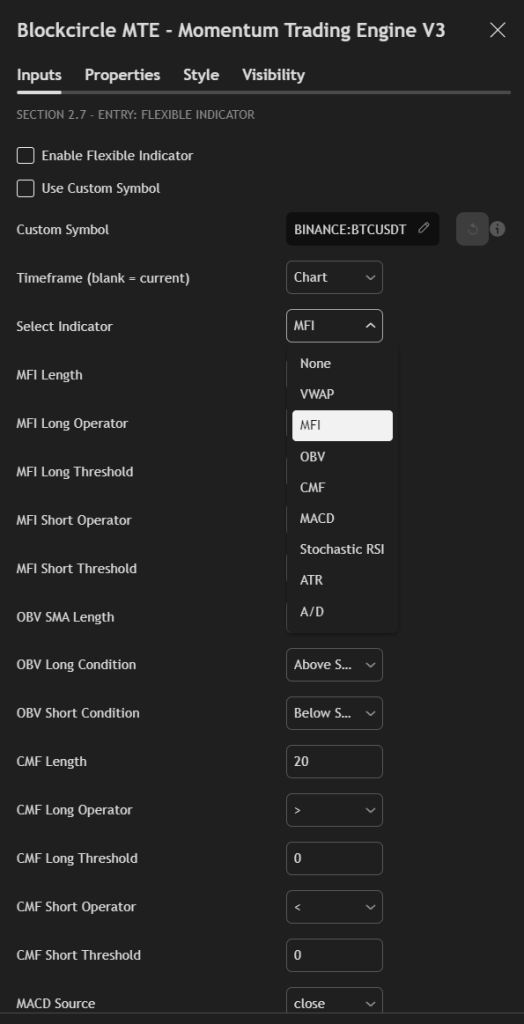
VWAP (Volume Weighted Average Price) Institutional traders’ average entry price. Price above VWAP suggests bullish sentiment, below suggests bearish. Most effective on intraday timeframes. Resets daily, making it ideal for day trading strategies.
MFI (Money Flow Index) Volume-weighted RSI that incorporates price and volume. Readings:
- Below 20: Oversold with weak volume (strong bounce potential)
- 20-50: Bearish money flow
- 50-80: Bullish money flow
- Above 80: Overbought with strong volume (potential exhaustion)
Superior to RSI when volume confirmation matters. Particularly effective in crypto where volume patterns are significant.
OBV (On Balance Volume) Cumulative volume indicator that adds volume on up days, subtracts on down days. Divergences between OBV and price often precede reversals:
- OBV rising while price flat: Accumulation (bullish)
- OBV falling while price flat: Distribution (bearish)
Use “Above SMA” for trend confirmation or “Rising/Falling” for momentum shifts.
CMF (Chaikin Money Flow) Measures accumulation/distribution over specified period. Ranges from -1 to +1:
- Above 0.05: Buying pressure
- Below -0.05: Selling pressure
- Near 0: No clear direction
Best used for confirmation rather than primary signals. High CMF with price breakout suggests sustainable move.
MACD (Moving Average Convergence Divergence) Classic momentum indicator showing relationship between moving averages:
- MACD Line: Fast MA minus Slow MA
- Signal Line: EMA of MACD line
- Histogram: MACD minus Signal
Multiple trigger options:
- Line crossovers: Traditional signals
- Histogram direction: Early momentum shifts
- Zero line crosses: Trend changes
Flexible MA types (EMA, SMA, WMA, RMA) allow customization for different market conditions.
Stochastic RSI Applies Stochastic formula to RSI values, combining both indicators’ strengths:
- More sensitive than regular RSI
- Better at identifying precise reversal points
- Effective in ranging markets
Settings include separate operators for long/short, K/D smoothing, and threshold levels. Can use crossovers or absolute levels.
ATR (Average True Range) Measures volatility for dynamic position sizing and stop losses:
- Volatility Filter: Only trade when volatility is within range
- Breakout Mode: Enter on volatility expansion
Multiplier determines sensitivity. Higher values (2-3x) for major moves, lower (1-1.5x) for tight ranges.
A/D (Accumulation/Distribution) Similar to OBV but uses closing price position within range. Crossover of fast/slow EMAs provides signals. Better than OBV in markets with gaps or irregular volume.
Custom Symbol Override Revolutionary feature allowing indicator calculation on different assets:
- Calculate BTC indicators while trading altcoins
- Monitor index indicators for individual stock trades
- Track sector leaders for follower trades
Time Window Application Each indicator can trigger if condition was met within past X bars:
- “MFI was below 20 within past 5 bars”
- “MACD crossed within past 10 bars”
- “VWAP touch within past 3 bars”
This catches delayed entries after initial signals.
SECTION 2.8 & 2.9 – PRICE LEVEL STRATEGIES
Price levels create dynamic support/resistance based on moving averages and price relationships.
Three Operating Modes
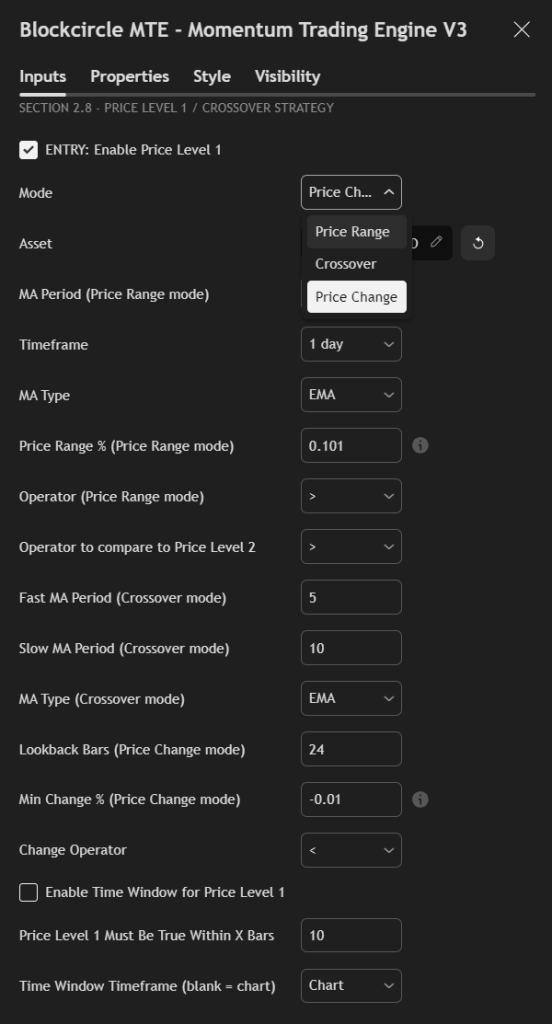
Price Range Mode: Checks if price is within certain percentage of a moving average:
- Price > 10% above 100 EMA: Extended, potential short
- Price > 5% below 50 SMA: Oversold, potential long
Crossover Mode: Traditional moving average crossovers:
- Fast MA crosses above Slow MA: Bullish
- Fast MA crosses below Slow MA: Bearish
Price Change Mode: Measures percentage change over specific period:
- Price up > 10% in 24 hours: Momentum long
- Price down > 5% in 12 hours: Capitulation short
Asset Selection Can reference different assets for conditions:
- Check if BTC is above 200 MA before buying altcoins
- Verify ETH momentum before trading DeFi tokens
- Ensure index strength before individual trades
MA Type Selection
- SMA: Simple average, equal weighting
- EMA: Exponential, recent prices weighted more
- HMA: Hull MA, reduced lag, faster signals
Period Settings
- 8-21: Short-term trend
- 50-100: Medium-term trend
- 200-300: Long-term trend
Price Range Percentage In decimal format (0.1 = 10%):
- Conservative: 0.05-0.10 (5-10%)
- Moderate: 0.10-0.20 (10-20%)
- Aggressive: 0.20+ (20%+)
Gap and Slope Validation
- Gap: Minimum distance between price levels (avoid convergence)
- Slope: Minimum angle of MA (confirm trend strength)
Operator Logic Controls how Price Level 1 relates to Price Level 2:
- “>”: Level 1 must be above Level 2
- “None”: No comparison, independent evaluation
SECTION 3.0 – EXIT STRATEGY CONFIGURATION
Proper exit management often matters more than entry signals. MTE provides institutional-grade exit options.
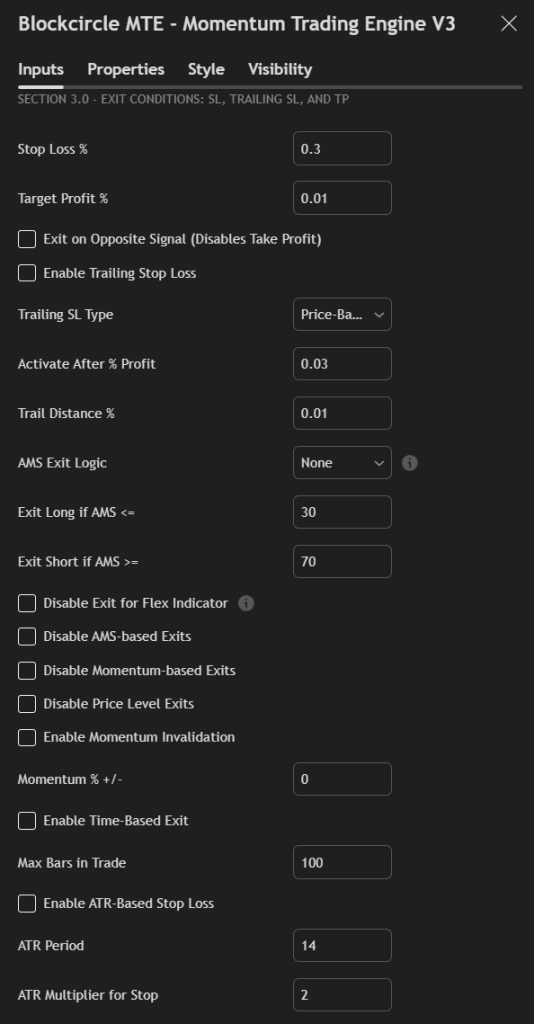
Stop Loss Percentage Initial risk per trade. Guidelines by strategy type:
- Scalping: 1-3% (0.01-0.03)
- Day Trading: 3-5% (0.03-0.05)
- Swing Trading: 5-10% (0.05-0.10)
- Position Trading: 10-20% (0.10-0.20)
Tighter stops mean more losses but smaller each. Wider stops mean fewer losses but larger each.
Target Profit Percentage Where to exit winning trades. Should maintain favorable risk/reward:
- Minimum 1
(TP = SL) - Standard 1
(TP = 2x SL) - Aggressive 1
+ (TP = 3x+ SL)
Exit on Opposite Signal – When enabled, closes positions when contrary signal appears. Useful for always-in-market strategies. Disables fixed take profit to prevent premature exits.
Trailing Stop Loss System
Enable Trailing Stop: Activates dynamic stop adjustment as trade profits.
Trailing Type:
- Price-Based: Percentage from current price
- Candle-Based: Below recent lows (long) or above highs (short)
Activation Level: Minimum profit before trailing begins. Prevents immediate stop-outs. Common: 2-5% profit.
Trail Distance: How close stop follows price:
- Tight (0.5-1%): Locks profits quickly but may exit prematurely
- Standard (1-2%): Balanced approach
- Loose (2-5%): Allows breathing room for volatile assets
AMS-Based Exits Uses Market Scorecard for dynamic exits:
- Exit long if score drops below 30 (market turning bearish)
- Exit short if score rises above 70 (market turning bullish)
Exit modes:
- None: AMS doesn’t affect exits
- TF1/TF2 Only: Single timeframe monitoring
- Any TF: Either timeframe can trigger exit
- All TF: Both must agree (most conservative)
Disable Exit Options Selective control over exit triggers:
- Disable Flex Indicator Exit: Indicator only enters, doesn’t exit
- Disable AMS Exits: Scorecard only enters, doesn’t exit
- Disable Momentum Exits: Momentum only enters, doesn’t exit
- Disable Price Level Exits: Price levels only enter, doesn’t exit
Useful when indicators give premature exit signals.
Momentum Invalidation Exits if momentum reverses by specified percentage. Catches trend changes early. Set to 0 to disable.
Time-Based Exit Maximum bars (candles) to hold position:
- Day trading: 10-50 bars
- Swing trading: 50-200 bars
- Position trading: 200+ bars
Prevents holding dead trades indefinitely.
ATR-Based Stop Loss Dynamic stops based on volatility:
- Period: ATR calculation length (14 standard)
- Multiplier: Distance in ATRs (2-3 typical)
Automatically widens stops in volatile conditions, tightens in calm markets.
SECTION 4.0 – TRADING CONFIGURATION
Final settings controlling strategy execution and alerts.
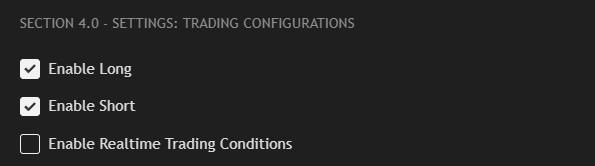
Enable Long/Short
- Long only: For spot trading or bull market focus
- Short only: For bear markets or hedging
- Both: Full market flexibility
Enable Realtime Trading Uses real-time data for live signals. When disabled, waits for bar close. Enable for immediate signals, disable for confirmed signals.
SECTION 4.1 – ALERT CONFIGURATION
Alert Timing
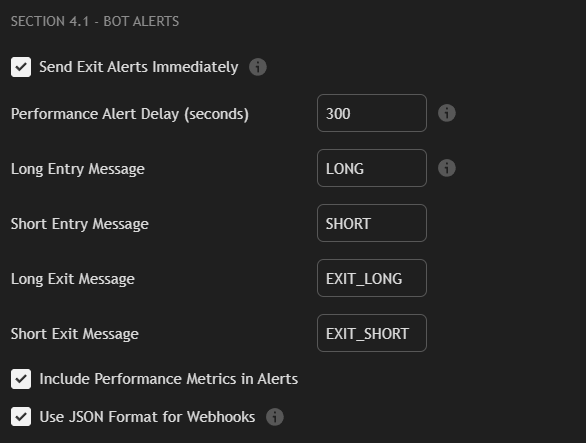
Immediate Exit Alerts: Sends exit notifications instantly when triggered.
Performance Alert Delay: Waits specified seconds before sending performance metrics, allowing TradingView to calculate statistics.
Message Configuration Customize alert messages for your automation:
- Simple format: Basic BUY/SELL commands
- JSON format: Structured data for webhooks
- Include performance: Adds metrics to alerts
Bot Integration Messages can trigger automated execution through:
- TradingView webhooks
- Discord/Telegram bots
- Custom automation platforms
- Exchange APIs
Format messages according to your bot’s requirements.
SECTION 4.2 – RISK MANAGEMENT ALERTS
Advanced monitoring system for strategy health.
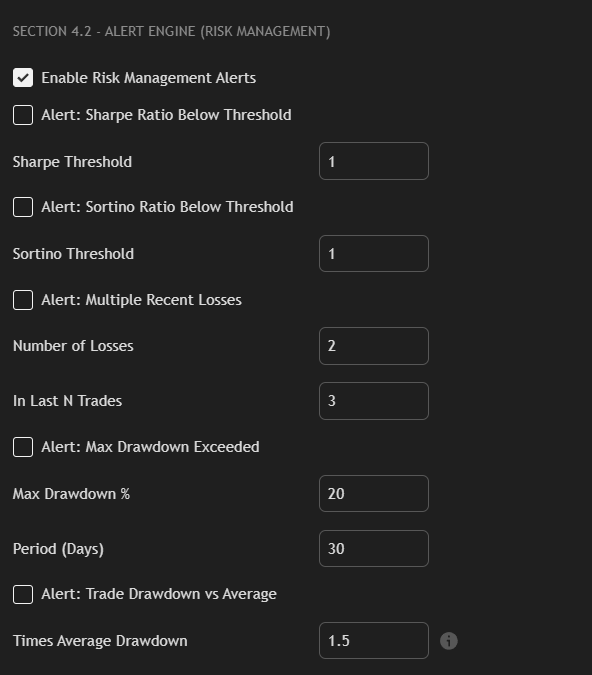
Sharpe Ratio Alert Triggers when risk-adjusted returns deteriorate. Sharpe below 1.0 suggests poor risk/reward. Below 0.5 requires strategy review.
Sortino Ratio Alert Similar to Sharpe but only penalizes downside volatility. More accurate for strategies with asymmetric returns.This is particularly powerful for cryptocurrencies and other hyper volatile assets.
Consecutive Losses Alert Warns of losing streaks:
- 2 losses in 3 trades: Normal variance
- 3 losses in 5 trades: Caution required
- 5+ consecutive losses: Strategy may be broken
Maximum Drawdown Alert Percentage decline from peak:
- 10-20%: Ideal for trading strategies
- 30-40%+: Significant, review and tweaks to entry or exit conditions required
Period setting determines lookback window.
Trade Drawdown Alert Compares current trade’s drawdown to average. Multiplier of 2X means alert when current trade draws down twice the typical amount. Identifies problematic trades early.
"Member since 2018. The real value is in the Discord and the market data. Basel and Hunter provide a perfect blend of expertise."
"Best subscription I've ever had. High ROI. Phenomenal community. Founders are top 1% in vision and innovation."
"No team better than Blockcircle. The alpha you get here you cannot find anywhere else."
"Basel and Hunter are godsends for anyone trying to navigate the crypto space."
"Best crypto group. I can't believe the guys who run this are so transparent and helpful."