The crypto feed says Time Period 1D on a Solana signal and the trade log says Timeframe 1day on a Ford position, and those two labels do not describe the same event. A daily candle closes when the market that prints it decides the day is over. Crypto never stops, so the boundary is just a clock reading. A US listed stock stops at the closing bell. If you work signals from both sides of this engine out of the same inbox, that difference is why one of them keeps filling near where you expected and the other keeps surprising you.
This is not a subtlety. It changes what you are allowed to do with the signal when you read it, and it changes how much of the move is already gone by the time you can act.
What the crypto feed actually timestamps
The MTE Crypto Trades page presents signals as cards rather than table rows. Each one carries a publisher, a Deploy action, a timestamp, a configuration label, and then a block of fields: Trading Pair, Trade Action, Prior Trade Position, Current Trade Position, Leverage, Price, Time Period and Notes. At capture the page header read 50 of 442, so the fifty on screen were a window onto a much longer feed.
Look at the timestamps on the top cards and a pattern falls out. Two signals dated the ninth of August 2026 are both stamped 12:00 AM. One is CONFIGURATION 20 buying BINANCE:CRVUSDT at 0.2266 on a Time Period of 360m. The other is CONFIGURATION 19 buying BYBIT:SOLUSDT.P on a Time Period of 1D. The next day, CONFIGURATION 19 sells that Solana perpetual at 76.93, and the stamp reads 12:11 AM.
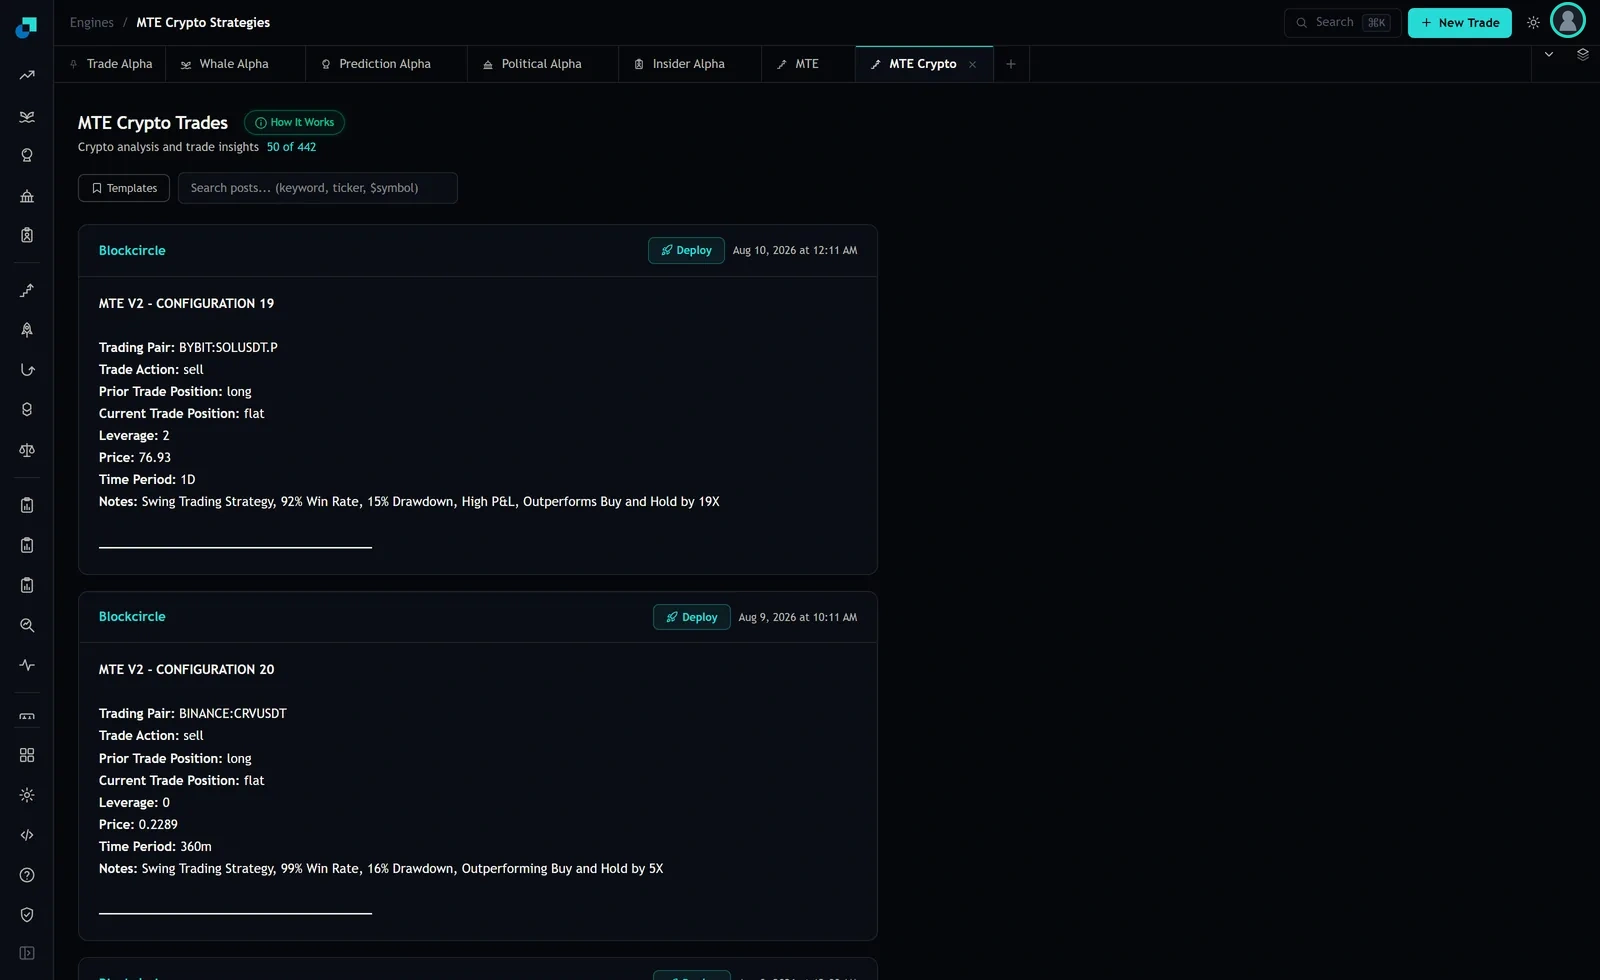
Midnight, midnight, and eleven minutes past midnight. That is what a daily boundary anchored at midnight looks like, with a short lag between the bar closing and the card being published. It also means the moment the signal describes is a moment you could have transacted in, because Bybit and Binance were open. Nothing about a crypto daily close prevents you from acting on it. The only thing preventing you is that you were asleep.
The clock the card is printed in is not stated on the card
Before you build a routine on those stamps, one honest gap. The CRV signal runs on 360m bars, which is six hours. If those bars were anchored at midnight, their boundaries would fall at six in the morning, at noon, and at six in the evening. The card that closes that CRV position, selling at 0.2289, is stamped 10:11 AM. It does not sit on that grid.
There are several explanations and the capture does not distinguish between them. The card clock may not be the same clock the bars are anchored to. The bars may be anchored somewhere other than midnight. The publish lag may vary. What I can tell you is that the trade log is explicit where the cards are not: the log's column header reads Time (UTC), and the signal cards carry no timezone at all.
So the first thing to do, once, is calibrate. Take one signal you can find in both places and compare its card stamp against the log's UTC time. That single comparison tells you which clock the feed is speaking in, and you never have to wonder again. Doing that costs five minutes. Not doing it means every delay calculation you make afterwards is off by a whole number of hours in a direction you have not established.
The same word on an equity row is not a tradable instant
Now the other side. The trade log at capture showed an active Ford position: asset F, strategy F MTE 1day, direction LONG, timeframe 1day, order type MARKET, time in UTC of 08/20/26 12:00 AM, entry 13.99 and current 13.93, with PnL of minus 0.43 percent and a duration of 5d 0h.
Midnight UTC. The US regular session runs from 9:30 in the morning to 4 in the afternoon New York time, which means that at the instant stamped on that row, no US listed share had traded for hours and would not trade again for hours. Whatever 13.99 represents, it is not a fill at the stamped time, because nothing filled at the stamped time.
That is the whole point. On the crypto side, the daily boundary is a moment in a market that is open. On the equity side, the identical label is a bar boundary in a data series, and the first moment you can act on it is the next opening auction. The engine is not doing anything wrong by labelling both 1day. The two just are not the same thing, and only one of them is an instruction you can follow immediately.
What a midnight boundary does to your week
Midnight UTC lands in the evening across the Americas, in the small hours across western Europe, and during the working morning across east Asia. Depending on where you live, a daily crypto signal either arrives while you are at dinner, while you are asleep, or while you are in a meeting. None of those is a moment you can reliably trade.
You have three honest options and they are not equally good. The first is to take delivery mechanically. The engine describes live signal delivery by email, Discord and Telegram, and the deployments panel adds webhook to that list, so a signal can reach a machine rather than a person. The second is to accept a fixed delay and measure what it costs you rather than pretending it is zero. The third is to run the timeframes whose boundary falls inside your waking hours, and to leave the ones that do not.
What you should not do is open the feed when you wake up and act on the top card without checking its age. Subtract the stamp from the current time and look at the number. On a 1D signal, an eight hour delay means a third of the bar you are trading has already elapsed. On a 360m signal, eight hours means the bar you are reacting to has completely finished and another one has started.
One more thing about acting at a boundary. The fact that a crypto venue is open at midnight UTC does not mean its book is as deep as it is twelve hours later. Liquidity is not flat across the day and it is thinner on weekends. If you are placing a market order into a boundary that lands at an odd hour, look at the book before you send it rather than assuming the depth you saw last Tuesday afternoon.
The price on the card, and what the notes leave out
The Price field is the strategy's reference price at the boundary. It is not your fill and it was never going to be. The gap between the two is your delay multiplied by whatever the pair did during it, plus the spread you crossed. On the Solana perpetual at 76.93 with Leverage 2, there is also a funding cost that neither the card nor the log shows.
Which brings me to the Notes field, because it is carried inside every card and it is the most quoted line on the page. CONFIGURATION 19's note reads Swing Trading Strategy, 92% Win Rate, 15% Drawdown, High P and L, Outperforms Buy and Hold by 19X. Those figures come from the strategy's own backtest and travel along with every signal it emits.
Whatever that backtest measured, it did not measure your delay, your spread, your funding on a levered perpetual, or the difference between a midnight reference price and the price you took at seven in the morning local time. A multiple against buy and hold is computed on the strategy's own fills at its own timestamps. On a daily strategy the delay is the largest cost in that list and it is entirely yours to control, which is the one piece of good news here. Calibrate the clock, measure your typical lag against the card stamp, and if the lag is a meaningful fraction of the bar, either automate the delivery or stop trading that timeframe.