The top is not the event. The two weeks after it are, and the reason people abandon trend systems is almost never the drawdown from the high. It is the stretch afterwards, where the strategy keeps doing exactly what it was built to do and the account keeps going sideways-down in small increments.
That stretch has a shape and the shape is predictable. If you know which phase you are in, you know which parts to endure and which single thing to change. Getting that backwards, enduring the part you should have changed and changing the part you should have endured, is how a working strategy becomes a discretionary one.
Phase one, the late entry that is supposed to happen
A trend system enters on confirmation. That is the rule that caught the trend in the first place, and its unavoidable consequence is that the last entry before a top is taken near the top. This is not a defect to be tuned out. It is the price of the mechanism.
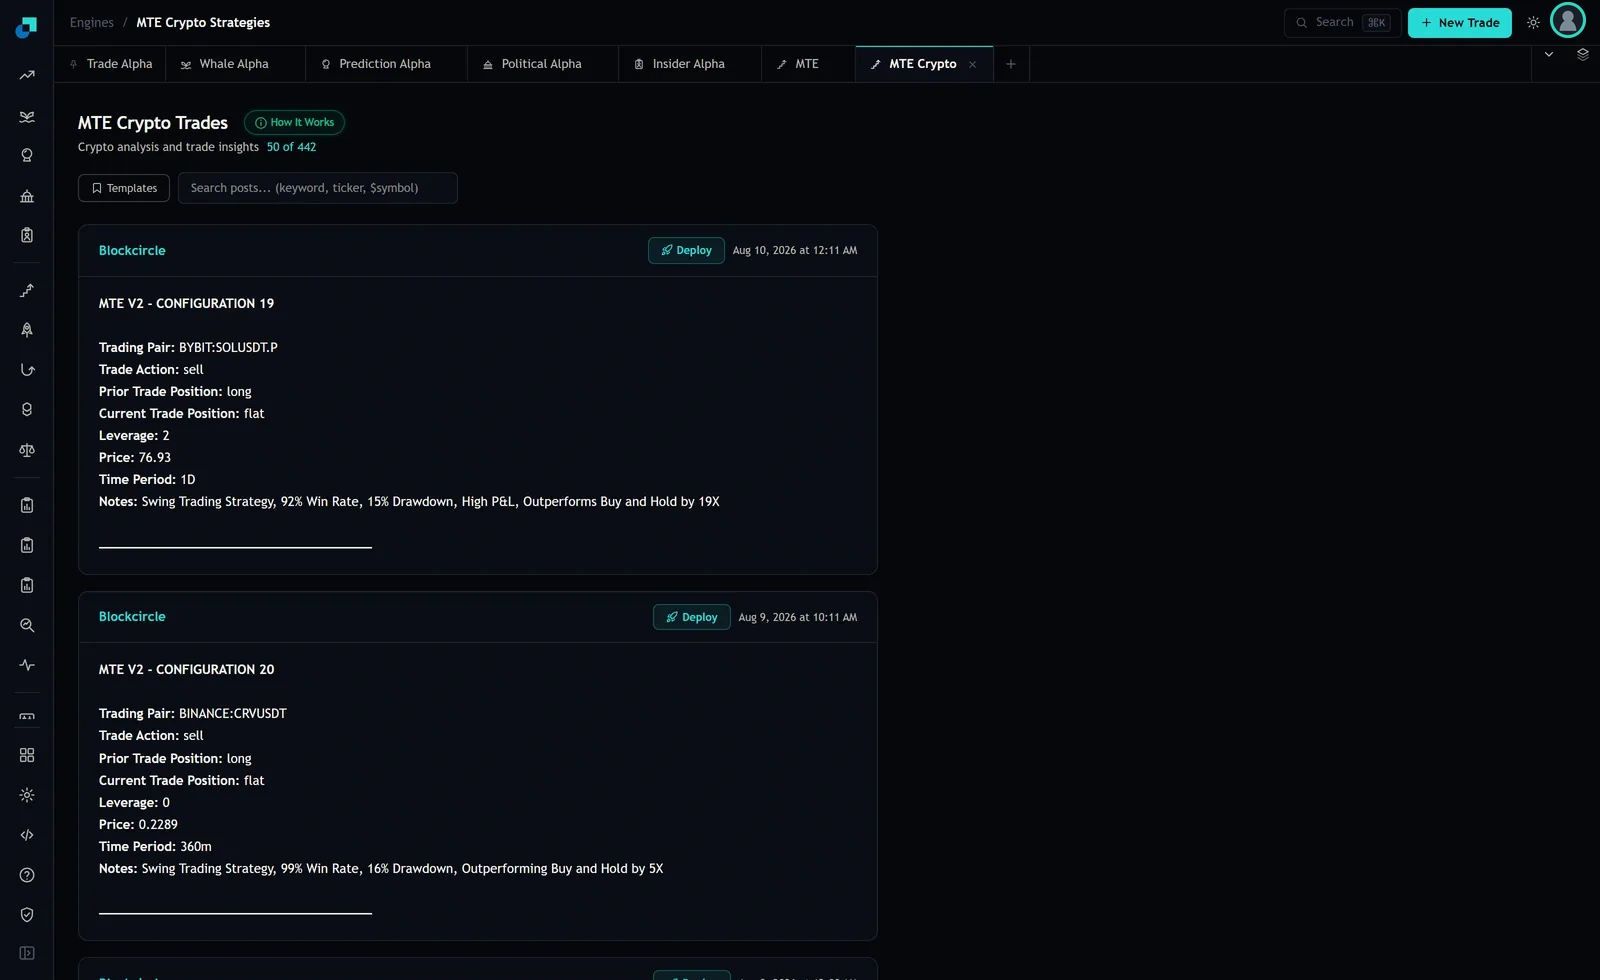
The engine's crypto feed makes this legible in a way most tools do not, because each card states the transition rather than just the action. The fields on a card are Trading Pair, Trade Action, Prior Trade Position, Current Trade Position, Leverage, Price, Time Period and Notes. A card reading prior position flat and current position long, printed into a tape that has stopped making new highs, is a late entry, and you can see it in the field instead of inferring it from a chart.
So the first discipline is simply to take that entry. It looks wrong at the time and it is indistinguishable, in the moment, from the entry that catches the next leg. If you start skipping the ones that feel late, you have replaced the system with your read of the tape, and the system's record no longer describes what you are running.
Phase two, the exit that arrives everywhere at once
The second phase is the one that reveals how little diversification you actually had. At capture the feed's top cards showed a Bybit Solana perpetual configuration going long to flat on a 1D period with Leverage 2, and a Binance Curve configuration going long to flat on a 360m period with Leverage 0. Different pairs, different venues, different bar lengths, same transition, roughly a day apart.
That is the normal behaviour of a set of crypto trend systems in a drawdown, because crypto correlations converge toward one when the whole complex is falling. The practical consequence for a retail book is worth stating in dollars. Four configurations at $500 each is not four positions. It is one $2,000 position with four different exit timestamps, and the timestamps cluster.
The mistake at this stage is to look at the exits, conclude the strategies are broken, and switch to a different set of configurations. You would be swapping one correlated basket for another correlated basket after the correlated event. The exits are the system doing its job. Sit through them.
Phase three, the whipsaw, and what it costs in dollars
Now the phase that actually takes the money, and it does not look dramatic. The trend is gone, price is oscillating, and the system enters and exits repeatedly on moves too small to pay for themselves.
There is a clean specimen of the geometry in the feed. The Curve configuration bought BINANCE:CRVUSDT at 0.2266 stamped 12:00 AM on 9 August 2026 and sold at 0.2289 stamped 10:11 AM the same day. That is a complete round trip inside eleven hours for roughly one percent gross.
Put costs against it. On a $500 position, one percent gross is about $5. Now assume you cross half a spread of fifteen basis points each way on a mid-cap alt and pay ten basis points of taker fee each way, which is fifty basis points for the round trip, or $2.50. Half the gross gone, on the trade that worked. Those cost assumptions are mine and yours will differ, so go and measure your own venue and pair rather than taking the figure. The structure is the part to keep: in a whipsaw phase the gross moves shrink toward the size of your costs while the trade count rises, and the arithmetic goes negative long before the win-rate label on the card changes at all.
What to change, and what changing it is not
One thing changes and it is size. Not the entries, not the timeframe, not which configurations you follow.
Cutting size during a whipsaw phase is not overriding the system, because the system has no opinion about your position size. It emits signals; you decide how much capital stands behind each one. Changing which signals you take is overriding the system, and that is the line.
The second thing to cut is leverage, and the feed tells you where it is. The Solana perpetual card carried a Leverage field of 2 while the Curve card carried 0. A levered perpetual in a whipsaw phase adds funding to the cost stack described above and adds liquidation distance to your list of things that can end a position without the strategy asking. Neither cost appears on the card.
The trigger to act on is your own trade count, not your equity curve. Count round trips per week across your configurations and keep the number somewhere you will see it. When it roughly doubles against a normal week, you are in phase three, and that is the week to halve size. Equity is a lagging and emotionally loaded signal; trade frequency moves first and it is unambiguous.
What the Notes field will keep telling you while all this happens
Every card carries a Notes line and it does not change with the phase. The Solana configuration's note read: swing trading strategy, 92% win rate, 15% drawdown, high P and L, outperforms buy and hold by 19X. The Curve configuration's read 99% win rate, 16% drawdown, outperforming buy and hold by 5X.
Those are static labels describing the configuration's backtest, attached to every signal it emits. They will say 99% win rate on the card that opens your seventh losing round trip of the month. They are not lying and they are not updating; they simply are not describing now.
Three things they leave out, all of which are yours. They exclude the spread you cross and the taker fee you pay, which is the entire subject of phase three. They exclude funding on a levered perpetual. And they exclude the gap between the timestamp on the card and the moment you actually place an order, which on a 1D configuration stamped shortly after midnight is however long it takes you to wake up. The same caution applies to the engine's library-wide tiles, a 96.6% average win rate and a 35.06 average profit factor computed across nine strategies and 350 backtested trades in total: short samples, backtested, before your costs.
The feed header at capture read 50 of 442, so the fifty cards on screen were a window onto a much longer history. If you want to know what your configurations did through the last trend break rather than what their labels claim, that history is where to look, and reading the two position fields down the page for the fortnight after the last top will tell you more about what you are about to experience than any percentage on the card.