Diligence on an external strategy library is not diligence on returns. It is diligence on a research process you cannot observe, whose output you are being shown after the fact. The performance table is the last thing to look at, because by the time a number reaches a table it has already survived every selection decision the vendor made, and those decisions are the exposure.
The Momentum Trading Engine is a useful worked example precisely because it discloses more than most vendors do. It publishes a reconstruction banner, versioned configuration identifiers, an admin control, and a trade log with fill-level fields. Each of those is an opening for a question you should be asking of any library, and the ones the engine leaves unanswered are the ones you should be asking loudest.
The headline table is an average with no dispersion
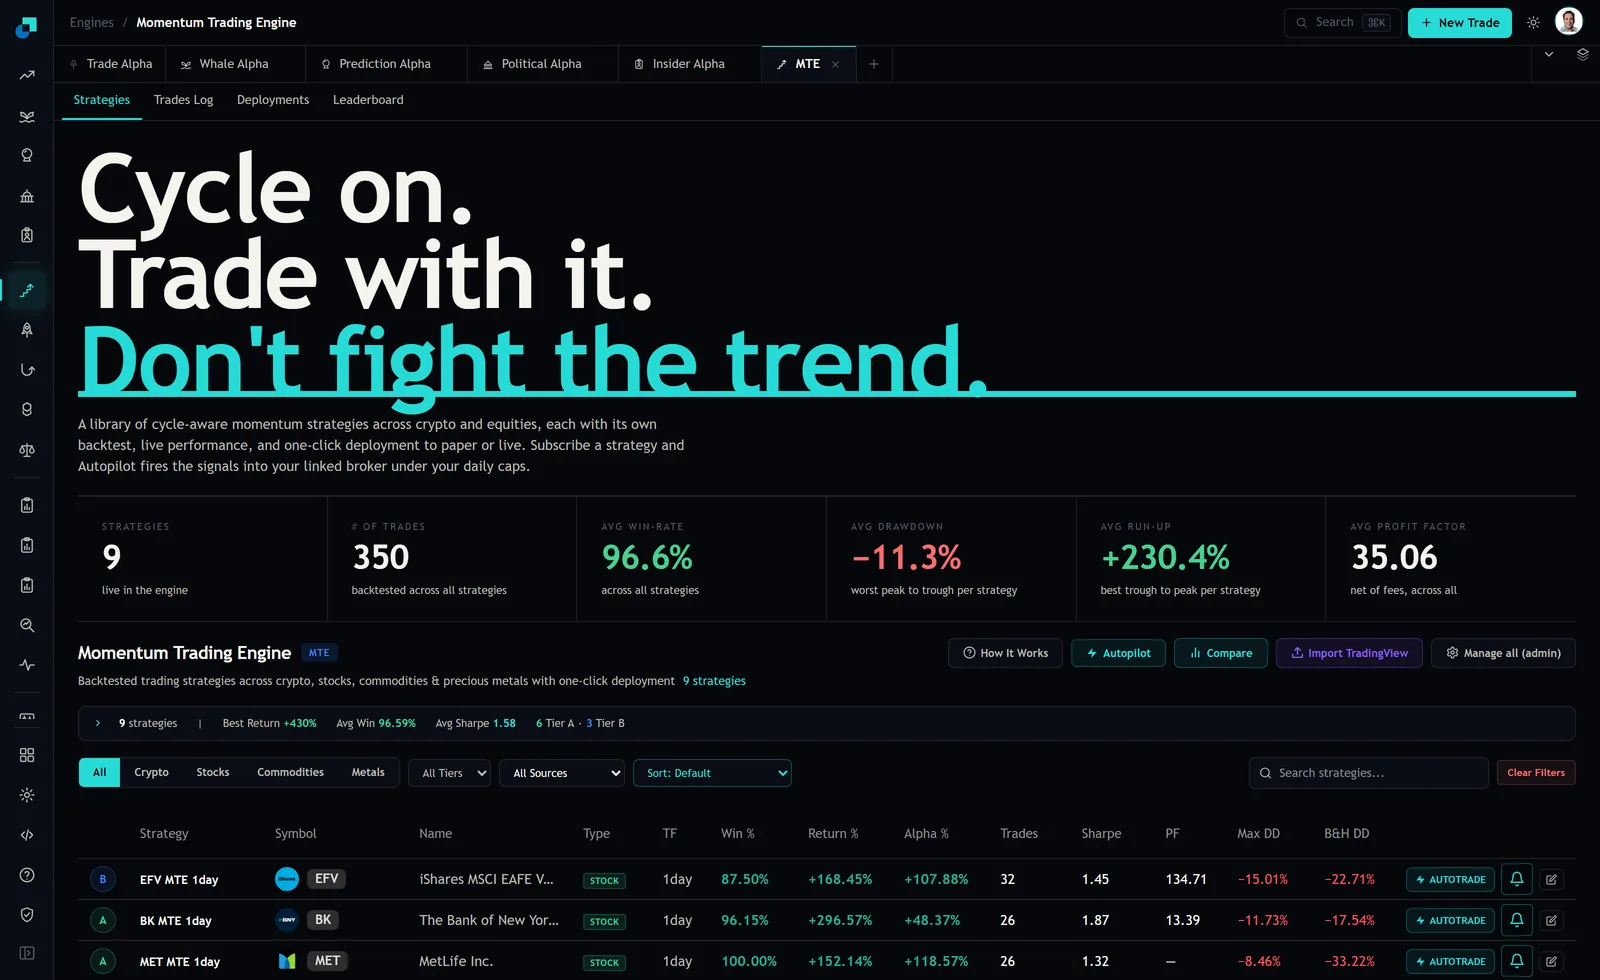
At capture the engine's header carried six figures. Nine strategies live, 350 trades backtested across all strategies, average win rate 96.6 percent, average drawdown minus 11.3 percent as worst peak to trough per strategy, average run-up plus 230.4 percent as best trough to peak, and average profit factor 35.06 net of fees. The strategies tab added best return plus 430 percent and average Sharpe 1.58.
Every one of those is a central tendency or an extreme across nine observations, and none carries a dispersion measure. That is the first request. Ask for the per-strategy table behind each average, and specifically for the drawdown and Sharpe of the worst strategy rather than the mean. A library whose mean Sharpe is 1.58 because four strategies sit at 2.5 and five sit at 0.7 is a different product from one where all nine sit near 1.6, and the header cannot tell them apart.
The second request follows from the arithmetic. 350 trades across nine strategies is roughly 39 per strategy. Ask what window those 39 cover and whether it is the same window for every strategy. Cumulative return and profit factor are both monotone in sample length, so a library that mixes an eight-month strategy with a four-year one and averages them is producing a number with no interpretation.
Reconstructed rows and the question they force
The engine's trade log does something most vendors avoid, which is to label the rows that never happened. At capture it showed 357 trades and carried a banner stating that 44 of the rows below had been reconstructed by replaying the strategy over historical candles, that no order was placed and no fill occurred for those, and that they show what the strategy would have done rather than what it did.
Take that disclosure seriously and then push on it. Roughly one row in eight in that log is a simulation sitting inside a table that otherwise reads as a trade history. Your questions are mechanical. Are reconstructed rows included in the published win rate and profit factor. Are they included in the leaderboard rankings. Is the reconstruction done on the candle close or on an assumed intrabar fill. Can they be filtered out through the interface or only by eye.
This matters beyond one vendor. Any library that backfills history for a strategy launched later is doing the same thing, usually without the banner. The engine's version of this is unusually honest and it still leaves you needing to know which side of the line each published statistic falls on. If the answer is that reconstructed and live rows are pooled, then the track record is a backtest with a live minority, and it should be sized as one.
Net of fees is a claim with no basis attached
The profit factor tile is labelled net of fees across all strategies. That phrase carries a specific commercial risk, which is that the fee assumption behind it is the vendor's, not yours.
Ask for the number. Commission per side in basis points or per share, the spread assumption, whether slippage is modelled at all, and whether the assumption varies by asset class. The engine spans crypto spot and futures, US equities, forex and commodities, and a single fee assumption cannot be correct across that range. The published configurations include one running at leverage 2 on a perpetual, which brings funding into the calculation, and funding on a perpetual held through a trending market is not a rounding error.
Then re-run the top strategies at your own cost stack. If a strategy's profit factor is materially sensitive to moving commissions by five basis points, its edge is a cost assumption rather than a market observation, and that is a finding you want in writing before you allocate rather than in the attribution six months later.
Universe construction and the configurations you never see
The naming convention in the published signal feed is itself a disclosure. Signals arrive labelled as MTE V2 with a configuration number, and the numbers observed at capture ran to at least 20. Two facts follow that you should confirm rather than assume. There was a V1. There are configurations that did not become live strategies.
Both are multiple-testing questions. If twenty configurations were parameterised and nine are live in the engine, the nine you can see are the survivors of a selection you cannot see. That does not make them bad, it makes their published statistics upward biased by an amount nobody has quantified for you. Ask for the count of configurations tested, the criteria by which a configuration graduates to live, and whether any live strategy has ever been retired and removed from the library. The answer to the last one determines whether the header statistics are a survivorship artefact.
The universe question runs alongside it. Ask how the symbol for each strategy was chosen. A strategy is a rule set plus an instrument, and if the instrument was selected after the rules were tested across many candidates, the strategy has been fitted twice.
Who can change a live parameter, and does it leave a trace
The strategies tab carries a Manage all control marked for admin. That is normal and necessary, and it is also the governance question. In any hosted library, someone can change a live strategy's parameters, and the performance history will simply continue across the change unless the system versions it.
What you need is an answer to three things. Does a parameter change create a new version identifier or mutate the existing one. Is there a timestamped change log an outside party can read. Does published performance restate history under the new parameters or preserve the old.
The third is the one that costs money. If a strategy underperforms, gets retuned, and the displayed track record silently becomes the retuned version's backtest, then every number you diligenced is replaced without notice and your attribution has no stable reference. Ask for it in the contract, not the sales call.
The staleness check nobody runs
Data vintage is the cheapest check available and it is the one that most often finds something. At capture the engine's crypto signal feed showed its most recent entries dated the ninth and tenth of August 2026, drawn from a feed of 442 items. The stock signal feed, of 114 items, showed its most recent entries dated the twenty-fifth and twenty-sixth of November 2025.
That gap is the finding. Whatever the explanation, and there may be a good one, the two halves of the product were not equally current on the day I looked. Before allocating to any strategy in the equities side of a library, establish the last date on which that side produced a signal, and make it a monitored condition rather than a one-time observation. The deployments tab will happily show an empty state, and the leaderboard at capture showed no ranked strategies at all, which means neither surface would have alerted you to a feed that had quietly stopped. A vendor library fails silently far more often than it fails loudly, and a stale feed produces no error, no alert and no drawdown. It simply stops producing the thing you are paying for, and the performance table keeps displaying the history as though nothing changed.