A composite regime score gets consumed in one of two ways. Either it is treated as a point forecast, in which case a reading of 61 becomes "the market is bullish" and someone sizes up, or it is treated as a conditioning variable, in which case a reading of 61 becomes "here is how the distribution of the next thirty days differs from the unconditional one". Only the second is defensible in front of a committee, and only the second gives you a number to put next to a risk limit.
The distinction sounds academic until you have to answer the question that always comes eventually, which is what the score has been worth. The scorecard publishes the composite. It does not hand you the conditional distribution behind it, and I would not trust one I had not built myself anyway, because the construction choices are where the entire answer lives. This is a description of how to build it and what has to be true for the result to survive contact with a sceptical reader.
What has to exist before the first number is computed
Three things, and the first one is the one people skip.
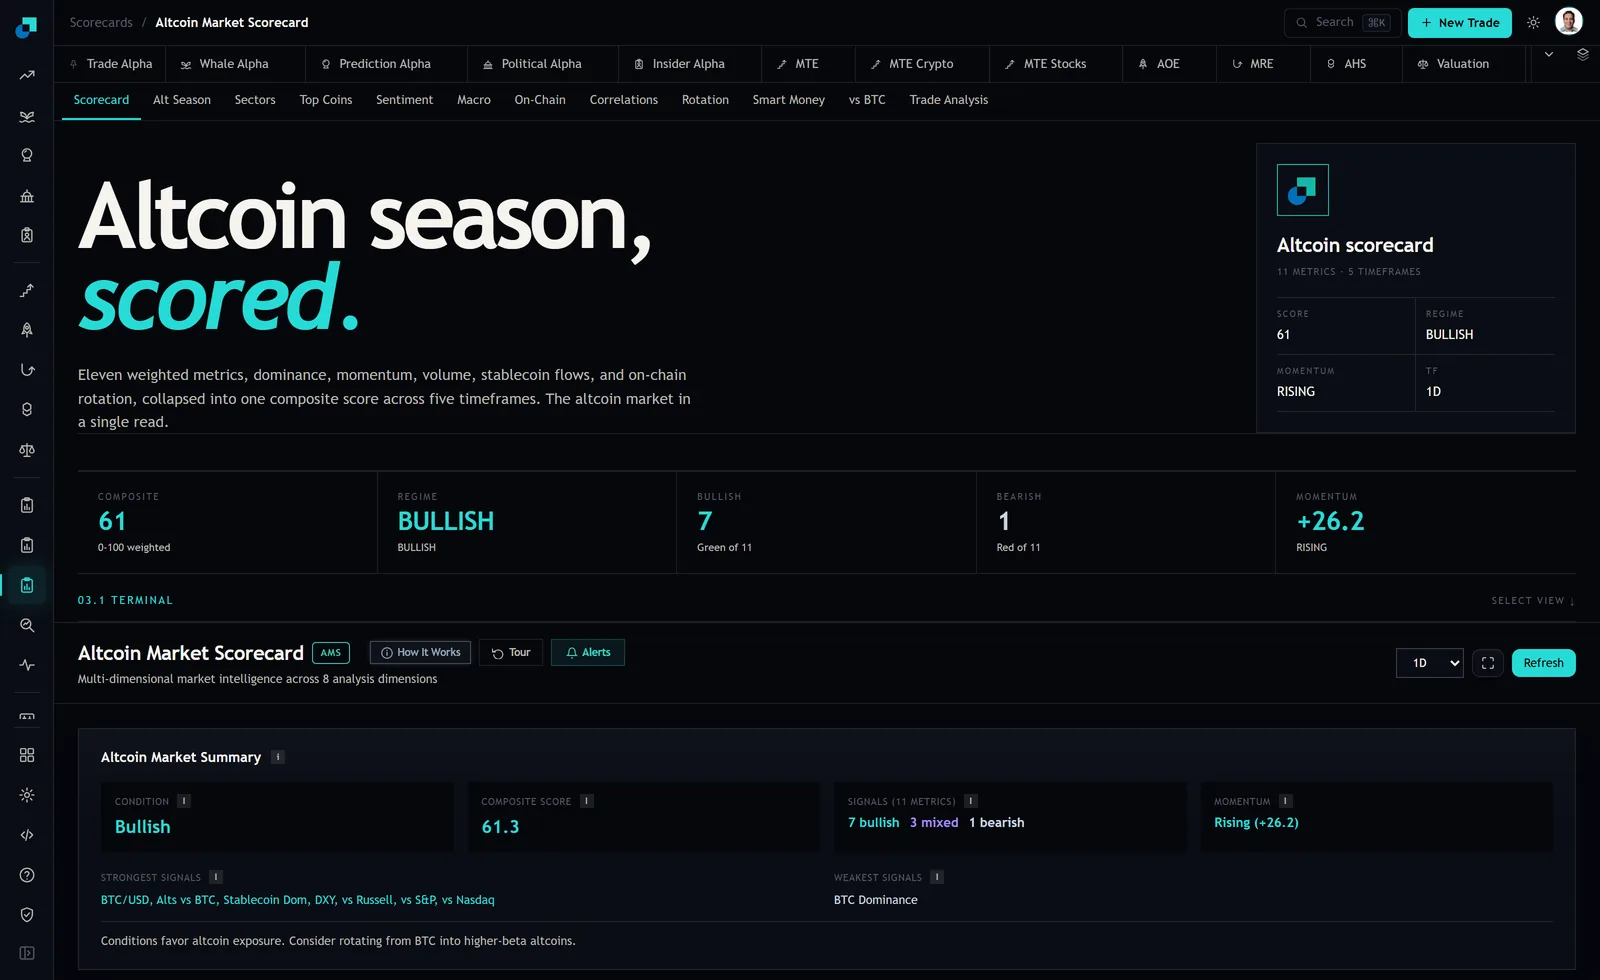
A point-in-time series of the composite itself. The module shows you the current reading across five timeframes, and the header in the screenshot below was 61 on 1D with a regime label of BULLISH and momentum RISING. That is one observation. A conditional study needs several years of them, each stamped with the moment it was read, and each guaranteed not to have been restated afterwards. If you are pulling a history rather than capturing your own, the first question to answer is whether that history is as-of or recomputed. If you cannot establish which, capture your own daily from today and be honest in the note that your study starts on the date the capture started.
A frozen definition of the alt universe whose returns you are measuring. Top 50 excluding Bitcoin and stablecoins, reconstituted monthly, equal weighted, is a defensible choice. So is a cap-weighted version. What is not defensible is today's list applied backwards, because today's list is the survivors, and survivorship will make every band look better than it was, with the high bands flattered most.
A return definition with the horizon fixed in advance. Thirty calendar days forward, total return, measured from the same daily close each time. Not "the next move". Not the best of several horizons.
The overlapping windows that will flatter every band you build
This is the error that most conditional studies in this space contain, and it is worth being precise about because it changes the conclusion rather than the decimal place.
Sample the composite daily and measure a thirty-day forward return at each observation, and consecutive observations share twenty-nine days of their return window. Three years of daily data gives you roughly 780 rows in the spreadsheet and about 26 genuinely independent thirty-day windows. Your software will happily compute a standard error from 780, and that standard error will be too small by a factor of roughly the square root of the overlap, which is between five and six here. A band difference that looks comfortably significant on the naive calculation is frequently indistinguishable from noise once you correct it.
It gets worse when you split by band, because regime scores are autocorrelated by construction. A composite built from exchange reserves, realized cap changes and dominance ratios does not jump between bands daily. It sits in a band for weeks. So the observations inside the 60 to 80 bucket are not 200 independent draws from the 60 to 80 state, they are perhaps eight or ten episodes of that state, each contributing many near-duplicate rows.
Two fixes, and use both. Report the number of distinct episodes per band alongside the row count, so a reader can see the real sample size. And compute the band statistics on non-overlapping windows, accepting that this leaves you with far fewer observations, because a small honest sample beats a large fake one in a review meeting.
Report the shape, not the median
A single median forward return per band invites exactly the point-forecast reading you were trying to avoid. Report the distribution, and use a fixed template so that every refresh is comparable to the last one.
| Statistic | Why it earns its place in the table |
|---|---|
| Median forward return | Central tendency without letting one melt-up episode carry the band. |
| Interquartile range | The dispersion is usually the finding. Bands often differ more in spread than in centre. |
| Worst decile | What the position looks like when the band is right about conditions and wrong about the month. |
| Hit rate against zero | Separates a band that wins often and small from one that wins rarely and large. |
| Distinct episodes | The honesty column. Ten episodes means the three rows above it are indicative at best. |
The cells are yours to fill from your own capture, and I am deliberately not putting numbers in them. Any figure I published here would be a claim about the future dressed as a claim about the past, and the entire value of the exercise is that your desk can reproduce it, not that you can quote it.
The tests that stop a band table from becoming a backtest artefact
Once the table exists, four checks decide whether it is allowed to influence sizing.
- Monotonicity. Do the statistics move in a consistent direction across adjacent bands, or does one middle band show a wild result the neighbours do not support. Non-monotonic tables are usually fitted noise, and the fix is fewer, wider bands rather than a story about why the 40 to 60 bucket is special.
- Subsample stability. Split the history in half by time and rebuild. If the ordering of bands survives both halves you have something. If the entire effect comes from one twelve-month stretch, you have a description of that stretch.
- Sensitivity to the horizon. Rebuild at fourteen and sixty days. A conditioning variable with real content should degrade gracefully as the horizon changes, not appear at thirty days and vanish at twenty-eight.
- Pre-registration of the next refresh. Write down, before the data arrives, what the next twelve months would have to look like for you to reduce the influence of the score. Without that sentence, every future refresh gets read as confirmation.
How to state the finding without overselling it
The output of all this is not a forecast and should never be phrased as one. It is a sentence of the form: conditional on the composite sitting in a given band, the forward distribution of the alt universe over the next month has been centred here, dispersed like this, and its worst decile has looked like that, across this many distinct episodes since the capture began.
Then say what it does not support. It does not support a return estimate for any individual token. It does not support a claim that the relationship is causal, since the composite is built from flow and valuation measures that co-move with the returns you are measuring. And with four or five years of usable crypto history split into five buckets, the worst decile of any single band is being estimated from a handful of episodes, which means the tail number in your table is the least reliable one on the page and is also the one a risk committee will quote back to you. Put the episode count directly beside it, every time, so the quote comes with its own caveat attached.