The best thing about a plain English summary on a macro dashboard is that you can read it in two seconds. The worst thing is the same. When the Global Liquidity Scorecard tells you the regime is RISK-ON and policy is EASING with a composite of 85, you have absorbed a conclusion without touching any of the evidence, and it is very easy to walk away feeling informed about something you have not actually looked at.
Those words are not decoration and they are not opinion. Each of them is a compression of a specific set of series. The useful skill is decompressing them, and it takes about a minute once you know which series sits behind which word.
Three words, three different owners, three different speeds
Start by separating what the header is telling you, because the fields are answering unrelated questions.
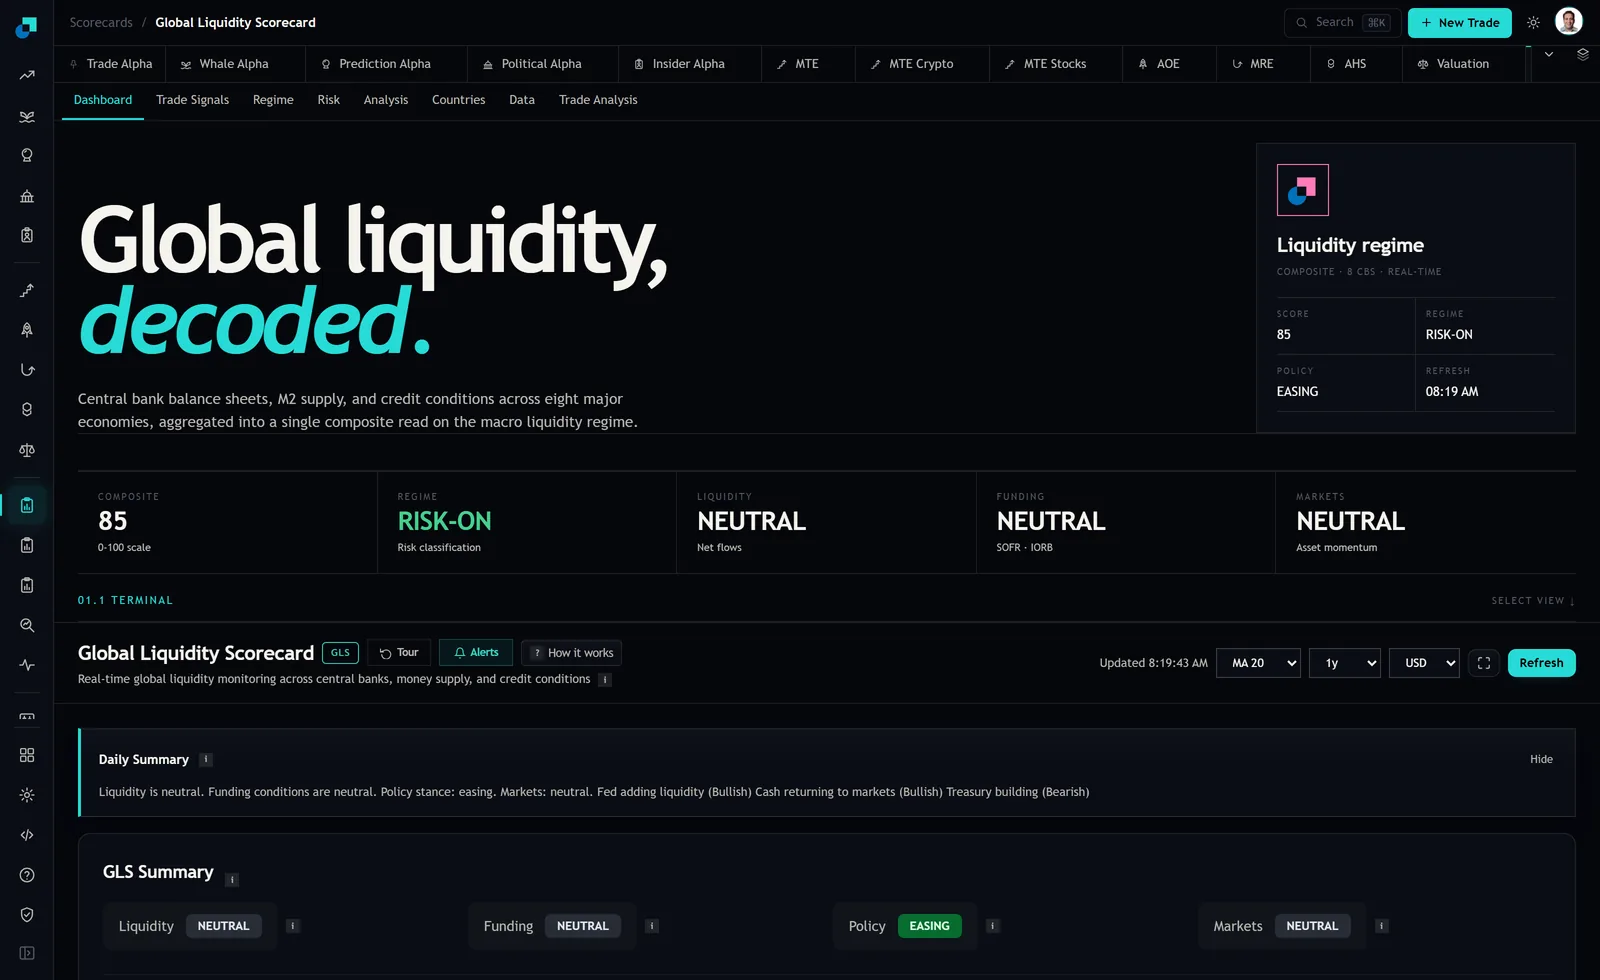
The composite, 85 on a 0 to 100 scale at the reading I captured, is a blend. It pulls in the aggregate central bank balance sheet, global M2 money supply, USD liquidity indicators and credit spreads across eight central banks and collapses them to one number. Owner: everybody at once. Speed: mixed, and dominated by its slowest component.
The regime label, RISK-ON, is a bucket applied to that composite. It is a translation of a number into a word, which means it can only ever be as current as the number it translates. Owner: the composite. Speed: identical to the composite, no faster.
The policy field, EASING, is about central bank intent. Owner: eight committees of people. Speed: the slowest of the three by a wide margin, because policy stance changes at meetings and meetings are scheduled months apart.
The regime word is not a second opinion
This is the mistake I see most and it is worth being blunt about. People read the score and then read the regime label and feel doubly confirmed, as though two indicators agreed. They did not. A regime label derived from a composite is that composite, rounded to a word. If the composite is high, the label will be friendly. There is no independent measurement happening in the second tile.
What that means practically: when you write down a read, write down the number, not the word. The number tells you 85, which is a position in a range, and you can ask whether it was 60 last month. The word tells you RISK-ON, which is the same on the day the composite crosses into the bucket and the day it sits at the very top, and those are extremely different situations for anybody deciding how much to hold.
Tracing a bullish driver back to a series
When a liquidity read moves and you want to know why, the honest answer is that only a handful of things are capable of moving a USD liquidity picture on a horizon shorter than a quarter. The exact wording any summary uses will vary, and I would not build a rule on the phrasing. The plumbing underneath does not vary.
- The central bank balance sheet. If the balance sheet is growing, reserves are being added to the banking system. This is the classic bullish driver and it is genuinely slow, updating on the publication calendar of each institution rather than continuously.
- The government cash balance. When a treasury builds up cash by issuing more than it spends, that cash is pulled out of the private system and parked. When it runs the balance down, cash flows back out. This one surprises people because nothing about policy has changed, yet the amount of money in circulation genuinely has. It is the most common source of a bearish driver during an otherwise easing period.
- Money supply aggregates. Real, fundamental, and the slowest thing on the board. Published monthly, describing a month that has already ended.
- Credit spreads and funding conditions. The only genuinely daily inputs. If the summary changed today and nothing was published today, this is almost certainly what moved.
The check that makes this useful takes one question. Ask: could the thing being described have changed since yesterday? If the driver is money supply, the answer is no, unless a release landed, and you can look up whether one did. If the driver is funding conditions, the answer is yes. That single question separates a summary that is reporting news from a summary that is restating a figure it has been carrying for three weeks.
What a friendly read actually licenses
Here is where I want to be careful, because RISK-ON is a phrase that sounds like an instruction and is not one.
A high composite with an easing policy stance is a statement about the conditions a market is operating in. It is not a forecast, it does not tell you which asset, and it certainly does not tell you that the next move is up. Markets have fallen in abundant liquidity many times, usually because the thing that hurt them had nothing to do with liquidity. A friendly macro backdrop removes one specific category of headwind. It does not remove earnings, positioning, or any of the reasons a particular thing you own might be a bad idea.
So the decision it feeds into is size, and only size. If you already have a view on what to own, a supportive liquidity read is a reason that a full position is defensible rather than aggressive. An unsupportive read is a reason to run the same idea smaller. Neither is a reason to go find something to buy, and using a macro dashboard as a shopping prompt is the fastest way I know to end up holding things you cannot explain.
One habit worth building this week. Every time you check the read, write one line in the same place you keep trade notes: the date, the composite value, the regime word, the policy word. Four items, ten seconds. After a couple of months you will have something the dashboard cannot give you on any single day, which is your own history of the number, and that history is what turns 85 from an abstract score into a reading you can actually place. Is 85 the highest it has been since you started watching, or has it been sitting there unchanged for six weeks? The tile looks identical in both cases. Your notes do not.