Every implementation shortfall report lives or dies on one input, and it is not the fills. It is the decision price. Get that wrong and the rest of the arithmetic is decoration, because the number you are attributing was set by whoever picked the benchmark rather than by the market.
The usual practice is to take the decision price from the trader, the portfolio manager, or the timestamp on the order ticket. All three are chosen by the same organisation being measured, and all three are chosen after the idea existed. When a mandate holder asks why the reported delay cost is two basis points rather than eleven, "we stamped the decision when the order was staged" is not an answer that survives a second question. A signal driven book has a better anchor available, and it costs nothing to use it.
Why a machine timestamp is the only defensible anchor
A Trade Alpha row is written by an engine, not by a person, and it is written before anyone on the desk has decided anything. That property is what makes it useful as a decision price. It was not selected to flatter the result, it cannot be moved once the report is being written, and it exists identically for the signals you traded and the signals you passed on.
The last point is the one that matters most in a review. Shortfall measured only across executed orders systematically understates cost, because the orders you abandoned were disproportionately the ones that ran away from you. Anchoring on the feed gives you the full population, including the rows you never sent, which is where opportunity cost actually lives.
There is a second, quieter benefit. The feed labels every row with the engine that produced it, and the source filter carries chips for MTE, MANUAL, AOE, MRS and MRE. That means shortfall is decomposable by signal origin without any extra tagging discipline from the desk, and desk tagging discipline is exactly the thing that fails silently for six months before anyone notices.
What the feed hands you and what it does not
Before you design the report, look at the columns you are actually going to reconcile against.
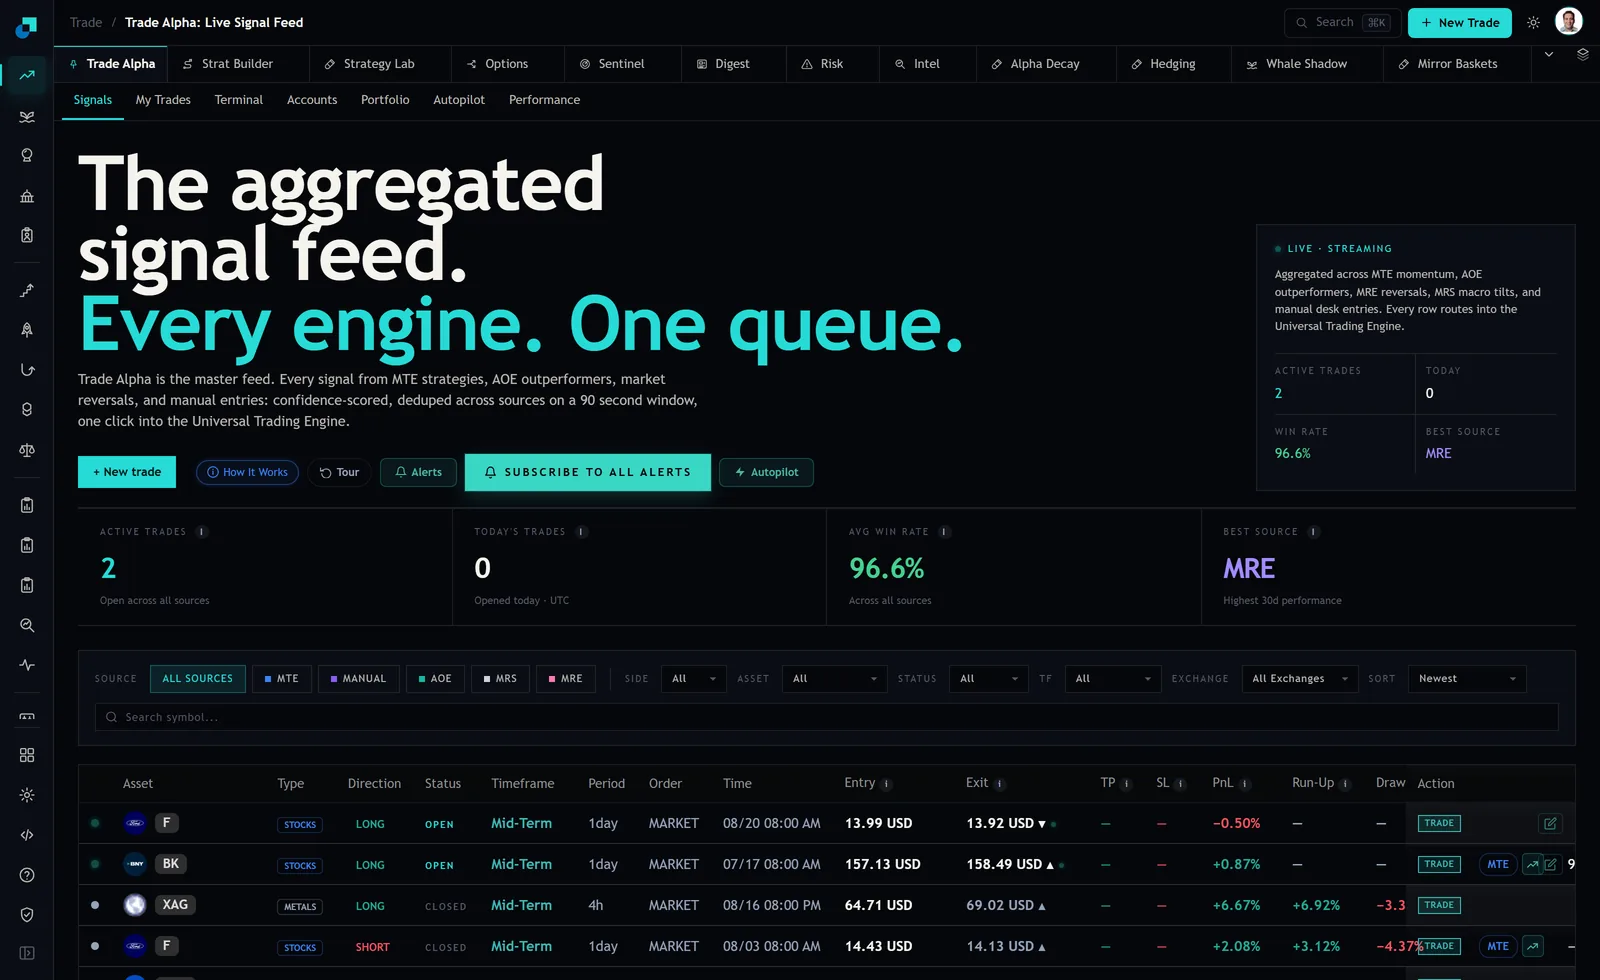
At capture the table carried Asset, Type, Direction, Status, Timeframe, Period, Order, Time, Entry, Exit, TP, SL, PnL, Run-Up, Draw and Action. The Time column is your decision clock. Entry is your arrival or fill reference depending on how your plumbing is wired, and you need to establish which before you write a line of code. Run-Up and Draw give you the path the position took, which is the input to the counterfactual half of the report.
Two limitations are worth naming up front rather than discovering during a client meeting.
The rendered timestamps in the capture are to the minute, shown as 08/20 08:00 AM and 07/17 08:00 AM. A decision clock quoted to the minute puts a hard floor under how finely delay can be attributed. If your underlying record carries a finer stamp, use it and say so. If it does not, quote delay in whole minutes and state the resolution in the report footnote. Reporting a delay cost of 1.4 basis points off a minute resolution clock is a precision claim you cannot support, and a sophisticated allocator will notice.
The second limitation is the dedup window. The platform describes signals as confidence scored and deduped across sources on a 90 second window. That is sensible product behaviour and it is a hazard for attribution, because two engines agreeing within that window do not produce two rows. Attribute cost to the source the row is labelled with, and do not build any metric that treats row count as a measure of engine agreement, because the feed is designed to collapse exactly that.
The four lines the report has to carry
Shortfall is the gap between the paper portfolio struck at the decision price and the money the fund actually has. The job of the report is to say where that gap went. Four lines cover it, and each one maps to a different person doing a different thing wrong.
| Line | Measured between | Who owns it |
|---|---|---|
| Delay | Signal timestamp and order arrival at the venue | The desk, and the plumbing between signal and staging |
| Execution | Arrival price and the volume weighted fill | The trader and the order type chosen |
| Impact | The fill path against a contemporaneous benchmark | Sizing, and the venue schedule |
| Fees | Commission, financing and venue charges | The broker relationship |
Opportunity cost on unfilled or partially filled orders sits alongside these four as a fifth line, priced at the decision price against the market at your cancel time. It belongs in the report even when it is uncomfortable, because leaving it out is how a desk convinces itself that passive limits are free.
The execution and impact lines cannot be cleanly separated when the whole book trades at market, and in the capture every visible row shows MARKET in the Order column. If that is what your production flow looks like, report the two as a combined line rather than inventing a split, and make the separation a project rather than an assumption.
Scaling the effort to the signal half life
A shortfall programme that treats every signal identically wastes most of its budget. The feed makes the relevant distinction visible in two columns. Timeframe read Mid-Term on the visible rows at capture, and Period read 1day on three of them and 4h on the silver row.
For a position that is opened on a daily bar and held for weeks, and the capture shows entry times running from 07/17 through 08/20, ninety seconds of delay is not a cost centre. It is rounding. Spending desk time on microsecond attribution for that book is a category error, and the honest thing to tell an allocator is that delay cost is immaterial at this horizon and here is the arithmetic showing why.
For anything intraday the position reverses completely. Delay is the dominant term, the minute resolution problem above becomes binding rather than academic, and you need venue timestamps rather than feed timestamps. Run the expensive version of the report only on the sleeves where the answer can change a decision.
Using Run-Up and Draw as the counterfactual bound
The question a mandate holder actually asks is not "what did execution cost" but "could you have done better, and how do you know". Run-Up and Draw are the two columns that let you answer without speculating.
Two closed rows in the capture make the point. The silver position showed a realised PnL of +6.67 percent against a Run-Up of +6.92 percent, so roughly a quarter of a percentage point of the best available path was given back at exit. The Ford short showed +2.08 percent realised against a Run-Up of +3.12 percent and a Draw of -4.37 percent, which is a materially worse capture ratio and a position that spent time well underwater before it worked.
Two closed rows is not a study and should never be presented as one. What it demonstrates is the shape of the report. Capture ratio against run-up tells you whether your exits are the problem. Draw against realised outcome tells you whether your stops would have been triggered by ordinary path noise, which is a sizing and risk question rather than an execution one. Both are computed from columns the feed already carries, which means the marginal cost of adding them to the monthly pack is close to zero and the marginal credibility is not.