The check that has saved me the most money is the one I do before anything goes wrong. Four losing trades in a row feels like evidence. Whether it is evidence depends entirely on the win rate of the thing you deployed, and that comparison takes about ninety seconds if you have decided in advance what number would actually change your mind.
The trades log gives you the raw material. What it does not give you is the threshold, and without a threshold you will do the thing everyone does, which is to intervene after the losses and sit out the recovery.
Count the streak properly before you interpret it
Three filters, in this order, and none of them is optional.
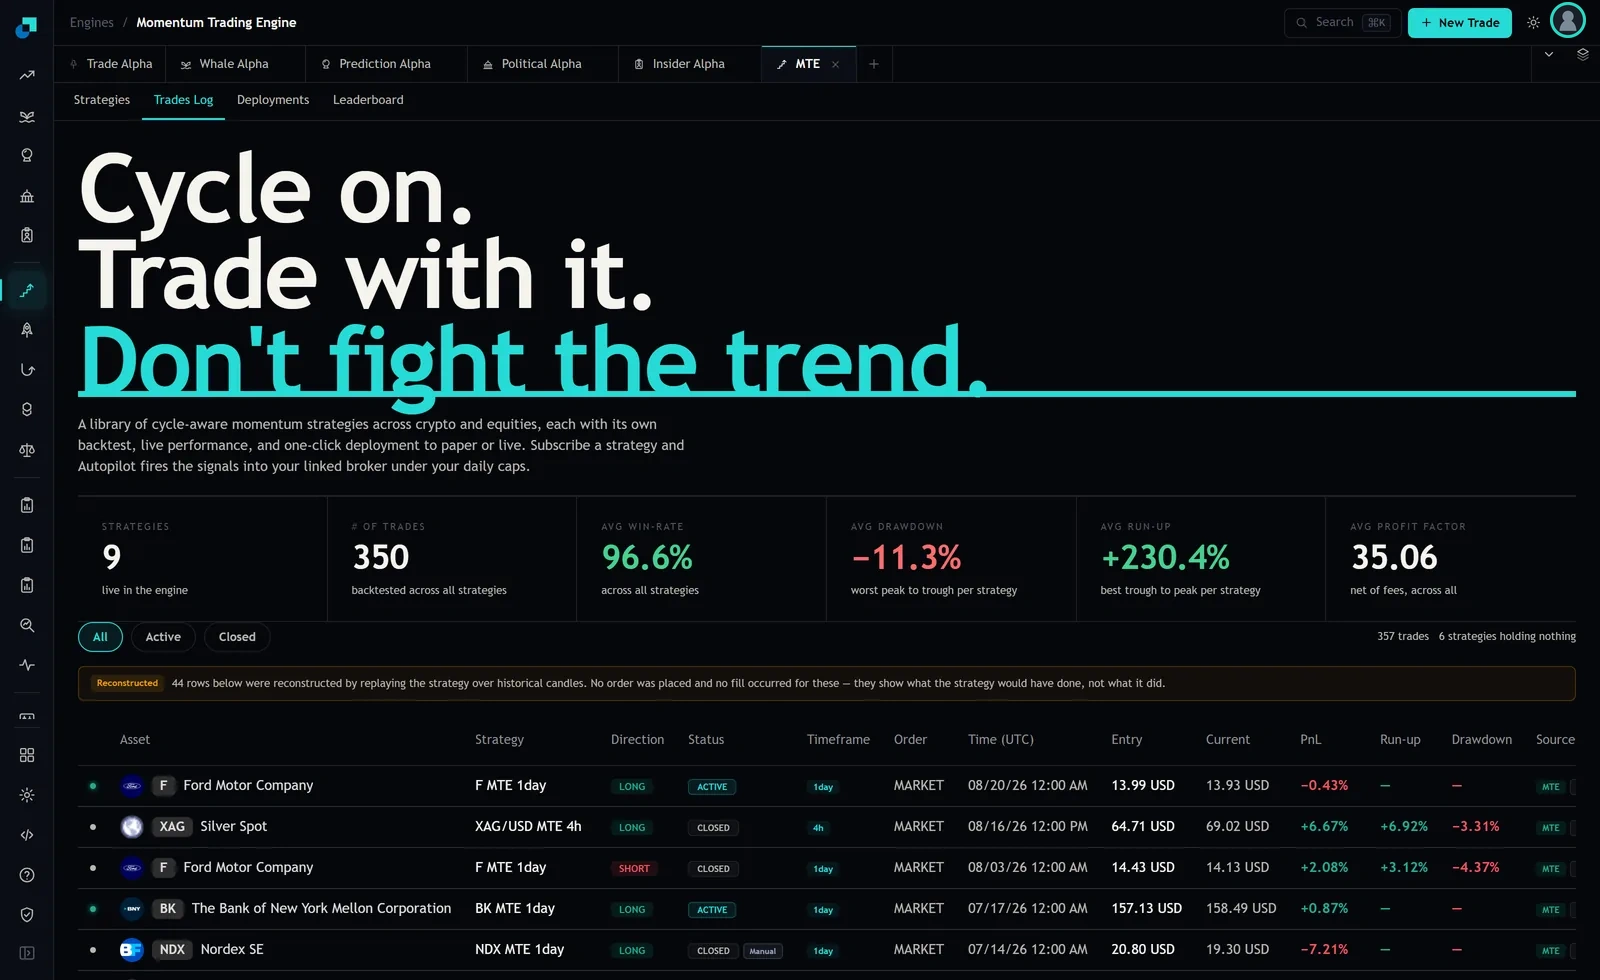
First, exclude the rows that never happened. At capture the trades tab showed 357 trades with a banner directly above the table stating that 44 of the rows below had been reconstructed by replaying the strategy over historical candles, that no order was placed and no fill occurred for those rows, and that they show what the strategy would have done rather than what it did. Roughly one row in eight is a simulation. A streak that runs through those rows is partly a streak of things that did not occur.
Second, use the Closed tab. The tabs at the top of the table separate Active from Closed, and an open position showing red is not a loss yet. At capture the header alongside the count read that six strategies were holding nothing, which tells you how much of the book was flat at that moment.
Third, and this is the one people get wrong, count per strategy and not across the whole log. Sort by Time in UTC within one strategy name and read the PnL column down. A book of nine strategies produces red rows constantly, because at any moment several of them are in a normal drawdown. Interleaving them manufactures a streak that no individual strategy experienced and that no threshold can be set against.
The formula that turns a streak into an expectation
Take your loss rate, call it q, so a 60 percent win rate means q of 0.4. Over N trades there are roughly N places a losing run could begin, and each has probability q to the power of k of producing k losses in a row. Set N times q to the power of k equal to one and solve, and you get the streak length you should expect to see at least once.
In words, the expected longest losing run is the log of your trade count divided by the log of one over your loss rate. It is worth having the answers in front of you rather than the algebra.
| Win rate | 50 trades | 100 trades | 200 trades |
|---|---|---|---|
| 50 percent | 6 in a row | 7 in a row | 8 in a row |
| 60 percent | 4 in a row | 5 in a row | 6 in a row |
| 70 percent | 3 in a row | 4 in a row | 4 in a row |
| 80 percent | 2 in a row | 3 in a row | 3 in a row |
Those are expectations, not limits. The more useful question is how far past the expectation something has to go before it means anything. Take a 60 percent strategy over 100 trades, where the table says expect about five. The chance of seeing eight in a row somewhere in those hundred trades is about one in sixteen, which is common enough that it will happen to you and should not trigger anything. The chance of ten in a row is roughly one in a hundred. That is the number I would use as an intervention line, because at that point the simplest explanation has stopped being bad luck.
Running it against the numbers this engine actually publishes
Now apply it to what the Momentum Trading Engine puts on its own header, because the result is instructive in a way that has nothing to do with luck.
The header reports an average win rate of 96.6 percent across all strategies, and 350 trades backtested across nine live strategies, which is about 39 trades each. Put a loss rate of 0.034 and a trade count of 39 into the formula and the expected longest losing run comes out at about one. One. Two losses in a row across 39 trades has a probability of roughly one in twenty three. Three in a row is around one in seven hundred.
So if you deploy something advertising a win rate in the mid nineties and you take three losses in a row, the arithmetic says something specific and it is not that you should hold on and trust the process. It says the 96.6 percent was never your win rate. There are three ordinary reasons for that and none of them require anyone to have lied. The sample is short, at 39 trades per strategy, so a couple of unlucky trades move the rate a long way. The published rate is a backtest and your live results include costs and delays that the backtest did not. And an average across nine strategies hides the spread underneath it, which in this library runs from configurations noted at 80 percent to ones noted at 99 percent.
That is the real use of the formula. It is not there to talk you out of worrying. It is there to tell you when a streak has become evidence that your input assumption was wrong, which is a much more useful conclusion than deciding the strategy has stopped working.
Where the arithmetic understates what will happen to you
The formula assumes each trade is an independent coin flip. Momentum strategies violate that assumption in the one direction that costs you money.
Momentum losses cluster. A choppy, directionless market produces a sequence of entries that all fail for the same reason, one after another, until the regime changes. The independent coin flip model has no way to represent that, so the real distribution of streak lengths has a fatter tail than the table. Treat the numbers above as a floor on what you should tolerate rather than a ceiling.
The same clustering runs across strategies. If four of your deployments are long the same kind of move on four correlated instruments, they will have their bad week together and your account will experience a streak far worse than any individual strategy's log shows. Count your effective number of independent bets honestly before you set an account level trigger.
And keep an eye on the size of the losses, not just the count. The engine's average drawdown tile reads minus 11.3 percent, described as worst peak to trough per strategy, and that figure comes from the same short backtests. A worst case drawn from 39 trades is not a worst case, it is the worst thing that happened in a small sample. Assume yours will be larger.
The rule to write down before you deploy anything
Write two numbers per strategy, before the first trade, in a place you will actually read. A pause level and a size cut level.
Set the pause level at the point where the streak is roughly a one in a hundred event given the strategy's own published win rate, and the size cut at the expected longest run from the table. Losing runs that reach the expected length are the normal operation of the strategy and you halve the position rather than stopping, which keeps you in it while reducing what the next few trades can do to you. Reaching the pause level means you stop and investigate rather than reason about it while positions are open.
Then decide what investigating means in advance too, because it takes one look at the log. Are the red rows concentrated in one instrument, one timeframe, or one direction? A streak confined to a single ticker is an instrument problem and you can drop the instrument. A streak spread evenly across everything at the same time is a regime, and regimes end. A streak where each loss is larger than the last is neither, it is a sizing failure, and that one you fix today.
Attach the trigger to something that reaches you. The engine describes live signal delivery by email, Discord and Telegram, so the trades are not the problem. Your review is, and a threshold you have to remember to check is a threshold you will check for the first time after the streak has already run.