You deployed a strategy, you got a fill, and the result does not look like the backtest. Almost everyone stops there and forms an opinion. The useful thing to do instead is pair that one trade with the specific backtest trade it was supposed to be, column by column, and find out where the two records first stop agreeing. It takes about five minutes per trade and after ten trades you have a number for your own execution instead of a feeling.
Do it in a fixed order, because the order is what saves the time. Three of the four checks below can end the exercise early.
Check first whether the row in front of you actually happened
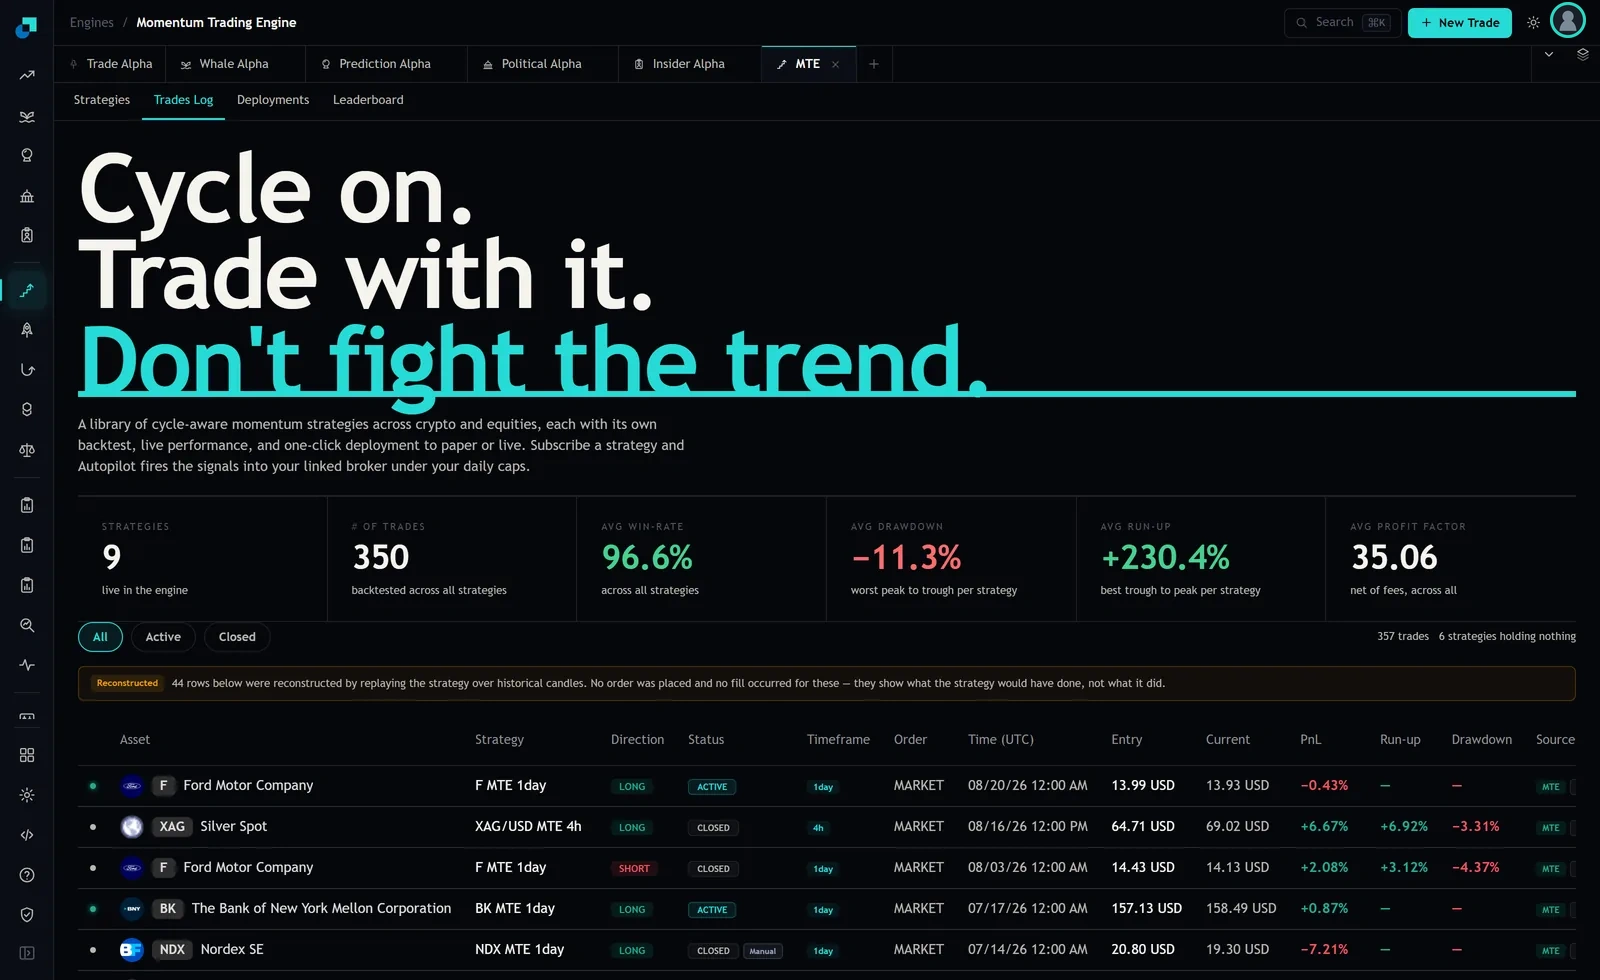
The trades log has a banner above the table that most people scroll past. At capture it read that 44 of the rows below had been reconstructed by replaying the strategy over historical candles, that no order was placed and no fill occurred for those rows, and that they show what the strategy would have done rather than what it did. The table held 357 trades in total, so roughly one row in eight is a replay.
If you pair a reconstructed row against a backtest row you are comparing a backtest to a backtest, and you will find no divergence, which feels like good news and means nothing. Use the Source column at the right of the table to tell them apart. It carries a tag, and at capture the tags included MTE with an Adopted marker on one row and a Manual marker on a closed row. Those markers are the difference between a trade the engine produced, a trade you took over, and a trade you closed by hand.
Then use the pills above the table. All, Active and Closed. Pair only Closed rows. An active position has no exit yet, and the header at capture read 357 trades with six strategies holding nothing, which is your reminder that a large part of the log is not a completed trade at all.
The join key is four columns, not the ticker
A ticker is not enough, because the same instrument can appear under more than one configuration. Look at the rows in the screenshot: Ford Motor Company appears twice under the strategy name F MTE 1day, once long and once short, at different dates. Nordex SE appears under NDX MTE 1day. Silver Spot appears under XAG/USD MTE 4h.
So the key is strategy name, direction, timeframe and entry timestamp together. The strategy name already contains the timeframe in this naming convention, which helps, but check the Timeframe column anyway because a 1day row and a 4h row on the same instrument are different trades with different expectations.
One detail about the timestamp that matters more than it looks. The 1day rows in the log are stamped at 12:00 AM UTC, which is a candle boundary rather than a moment when anything traded. The backtest's entry is the price associated with that boundary. Your fill happened when your broker was open and your order reached the book. That gap is not a bug and it is not the vendor's fault, but it is the source of most of what you are about to measure, and it is why the first field you compare is time.
Field one and field two, the timestamp and the entry price
Write down two numbers for the trade: the signal timestamp from the Time (UTC) column, and the timestamp on your own broker confirmation. The difference is your decision-to-execution delay, and for a daily strategy on a US equity it is frequently many hours, because a midnight UTC signal cannot be filled until the next session opens.
Then compare the Entry column against your fill price. Do it in basis points rather than dollars so it is comparable across instruments. Take the Ford row in the screenshot, entered at 13.99 USD. If you filled at 14.03, that is 4 cents on 13.99, which is 29 basis points, and on a 1,000 dollar position it is 2.90 dollars. That sounds trivial until you multiply it by the round trip and by the trade count. The engine reports 350 backtested trades across nine strategies, which is roughly 39 per strategy, so a 29 basis point entry slip plus a similar exit slip on 39 trades a year is close to 2.3 percent of the position's turnover cost, before commission and before spread on the exit.
Hold the sign as well as the size. Slippage that is consistently against you is a routing or timing problem you can fix. Slippage that is random around zero is spread noise you cannot fix and should simply budget for.
Field three and field four, the exit and what the PnL is measured on
The third field is duration, and it is where most large divergences live. The log's Duration column gives the engine's holding period, and the Status column tells you how the trade ended. In the screenshot one closed Nordex row carries a Manual marker next to its status. That marker is the whole story for that trade. The strategy did not exit it, a person did, and the comparison against the backtest row is now measuring a human decision rather than an execution cost. Set those aside in a separate bucket and count them, because a strategy that you override four times a year is not the strategy you deployed.
The fourth field is the basis of the PnL figure itself. The log shows PnL as a percentage alongside Run-up and Drawdown columns, and on the active rows in the screenshot the Run-up and Drawdown cells are empty while the PnL cell is populated, so an in-flight trade shows a return without the excursion context that would tell you how it got there. More importantly, that percentage is computed from the engine's entry and exit prices. It does not know your commission, your spread, your financing, or the fact that you were filled 4 cents higher. Your realized number will always be worse, and the gap is exactly what this exercise is measuring.
Turning ten paired trades into one decision
Keep a plain sheet with seven columns: strategy, entry date, signal price, your fill, entry slip in basis points, exit slip in basis points, and a flag for manual intervention. Ten closed trades is enough to see the shape.
Three outcomes, and each points at a different action. If your median round trip cost is small relative to the strategy's average trade, you have nothing to fix and you can stop measuring monthly. If it is large but consistently in one direction, change how you send orders before you change anything about the strategy, since chasing the open with market orders is the single most common cause and using a limit at or inside the signal price for a daily strategy costs you some fills and saves the rest. If the manual flag is set on more than one trade in ten, the execution is not your problem at all.
Then do the arithmetic that decides whether the strategy survives contact with you. Take the backtest's average profit per trade for that strategy, subtract your measured median round trip cost, and multiply by the trade count you expect in a year. If the answer is materially below what the backtest implied, the honest conclusion is that this configuration is not viable at your size and at your fill quality, and no amount of patience changes that. Better to find that out over ten trades on a small position than over a year on a large one.