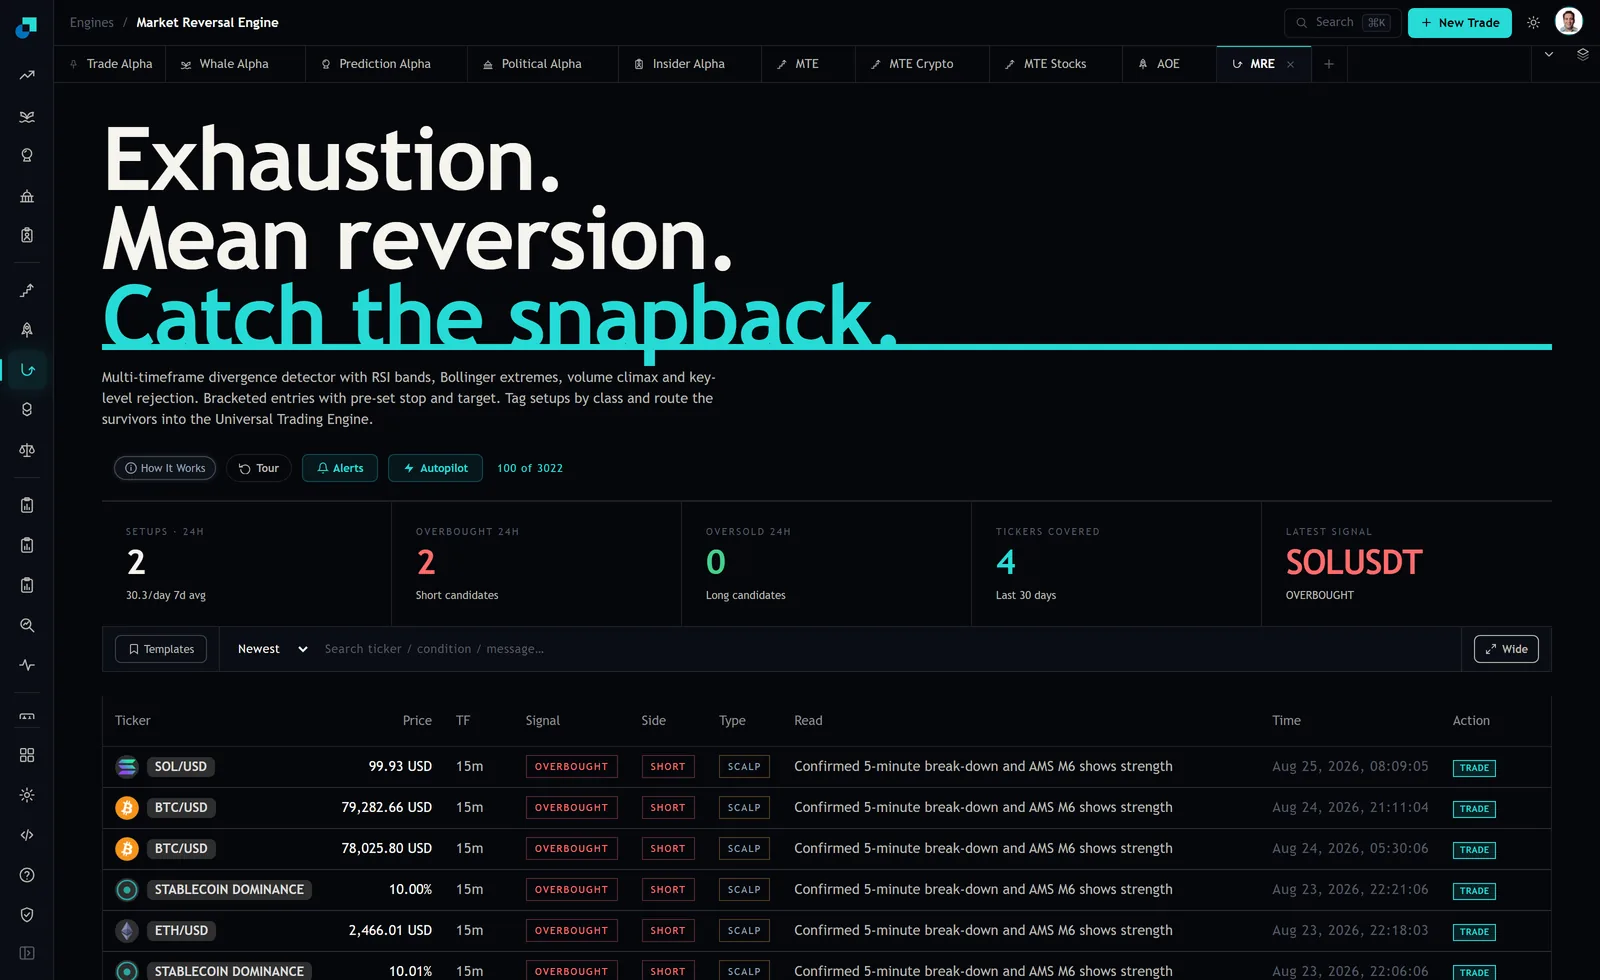
The MRE setup table gives you nine columns per row and roughly thirty new rows a day. The seven day average on the dashboard read 30.1 setups per day at capture, which is about one every fifty minutes across the trading day. Nobody reads thirty rows properly. What you actually need is a way to kill most of them in two seconds and read the survivors carefully, and that starts with knowing which columns carry information and which are along for the ride.
Here is a real row from the capture. BTC/USD, 79,282.66 USD, 15m, OVERBOUGHT, SHORT, SCALP, "Confirmed 5-minute break-down and AMS M6 shows strength", Aug 24 2026 at 21:11:04, with a TRADE button on the end. Nine fields. Let us go through what each one is doing.
The nine columns, and the two that say the same thing twice
Ticker and Price are orientation. They tell you what the setup is on and roughly where the instrument was when it fired, which matters later when you work out how far price has travelled since.
TF is the timeframe the signal was computed on. Every visible row in the capture reads 15m.
Signal and Side are the pair worth noticing, because they are not two facts. Signal reads OVERBOUGHT and Side reads SHORT. On a reversal engine, overbought implies short and oversold implies long by construction. The Side column is the Signal column translated into a direction. It is convenient, and it is zero additional evidence, so if you have been reading a row and feeling reassured that two separate fields agree with each other, stop.
Type is the setup class. In the capture every visible row is tagged SCALP. The module describes tagging setups by class and routing the survivors into its Universal Trading Engine, so this field is the hook the automation hangs on.
Read is the sentence explaining what fired. Time is when. Action is the TRADE button that carries the setup through to an order ticket with the bracket already attached.
TF and Time are the two fields that decide it
Everything else on the row describes the setup. TF and Time together tell you whether the setup still exists, which is a different and more urgent question.
Do the arithmetic on the row above. The signal is on a 15m timeframe and it is stamped 21:11:04. If you sit down and open the dashboard at nine the next morning, roughly twelve hours have passed, which is about forty eight bars on the chart the signal was computed on. The reversal configuration that produced it resolved, one way or the other, some forty five bars ago. What you would be trading is not that setup. It is a fresh guess wearing an old row's clothing.
My working rule is that a 15m setup is live for two or three bars, so thirty to forty five minutes, and after that it needs to be re-derived from scratch or dropped. On an hourly signal you get a few hours. On a daily signal the row is genuinely still useful the next morning. The rule scales with TF, which is exactly why TF and Time have to be read as a pair rather than glanced at separately.
This is also the single best reason to sort the table by Newest, which is what the sort control was set to in the capture, and to ignore anything below the fold. On a feed running at thirty setups a day, the bottom of the first page is already yesterday.
What the Read column is really telling you
Read is the only column that carries reasoning rather than classification, and it repays close attention for a reason most people miss. In the capture, all five visible rows carry the identical Read string: a confirmed five minute break-down, with the AMS reading showing strength. Same sentence, five times, across BTC/USD twice, stablecoin dominance twice and ETH/USD once.
Five rows with one Read string is one observation, not five. The engine noticed a condition and that condition was present on several correlated instruments at once. If you take all five you have taken one trade at five times the size, and you will find that out at the same moment on all five.
The other thing Read does is name the engine that fired. The prefix in the text and in the Latest Signal tile, which read AMS M3 on BTC/USD at capture, tells you whether the setup came from the breadth engine, the momentum engine or the liquidity engine. That determines how long the setup stays valid, and it is the subject of its own conversation. For row reading, the short version is that the engine name is available to you and most people never look at it.
Type is a sizing instruction wearing a label
SCALP is not a description of the trade's personality. It is telling you the holding window the bracket was built around, and therefore how much room the stop has been given.
A scalp-class bracket on a fifteen minute chart has a tight stop by construction, and a tight stop has a specific consequence for a retail account that nobody puts on the dashboard: your costs are a much larger fraction of the risk. Suppose the stop sits sixty basis points away and your all-in round trip, spread plus fees, is fifteen basis points. You have handed a quarter of your risk budget to the venue before the trade has an opinion. On a wider daily-class setup with a stop three hundred basis points out, the same fifteen basis points is a rounding error.
So the practical reading of Type is a question about your own venue, not about the setup. If the class is tight and your costs are not, that row is not tradeable by you, regardless of how good the signal is. This is checkable once, this week, with your actual fee schedule and your actual spread at the hours you trade, and it will permanently remove a whole class of rows from your attention.
The rows I kill without opening a chart
Four filters, applied in order, and each one is a single glance at a single field.
- Time older than a few bars of the row's own TF. Gone, no exceptions, and this alone clears most of a morning's backlog.
- A Read string identical to a row I have already taken. That is the same trade, and I take it once.
- A Type whose bracket is too tight for my costs at that venue and that hour.
- A ticker I do not already understand. The tickers-covered tile read 4 over the last thirty days at capture, and one of the four in the visible rows is stablecoin dominance, which is not a thing you short in the way the Side column implies. A row on an instrument you have not thought about before is not an opportunity, it is homework.
What survives that gets the careful read: the chart at the signal timestamp, the level the engine says was rejected, and whether the bracket that comes attached fits the size you are actually willing to lose. That is the point where the row stops being a row and becomes a decision, and it should be happening to two or three of the thirty, not to all of them.