The Asset Outperformer Engine describes itself in allocation terms. The copy under the hero says the top decile becomes the long book and the bottom decile becomes the short book, and offers to let you subscribe a basket and deploy it via paper or live. That is a strategy product. Most desks that would find this module useful do not have a slot for another strategy, they have a policy mix that was approved by a committee and a mandate to add value around it. The interesting question is not whether to run the engine's book. It is whether phase state can be a legitimate tilt input inside bands you already have.
What the overlay is allowed to move, written before you open the board
The discipline that makes this workable is that the overlay's permissions are fixed in advance and never reference the signal. Take a policy mix as an example: 55 percent equity, 30 percent fixed income, 10 percent real assets, 5 percent digital, with plus or minus 500 basis point bands around each sleeve and a hard rule that band breaches are rebalanced rather than argued about. The overlay is then defined negatively. It may move sleeve weights within those bands. It may not change the policy weights, it may not create a sleeve that policy does not contain, and it may not take the total of active deviations above whatever risk budget you have named.
Written that way, the worst case is bounded before the signal has said anything. If the ranking is useless for a year, the cost of having run it is the tracking error you spent plus the trading cost of moving within the bands. Both are measurable. That bounded-downside framing is what gets an overlay through a committee, and it is a different conversation from the one that starts by showing the committee a top decile.
Phase is a state, and the board ships with it filtered
The phase column is the natural overlay input because it is categorical rather than continuous. A tilt wants to know whether a sleeve's constituents are in an uptrend state, not what their scores are to two decimals.
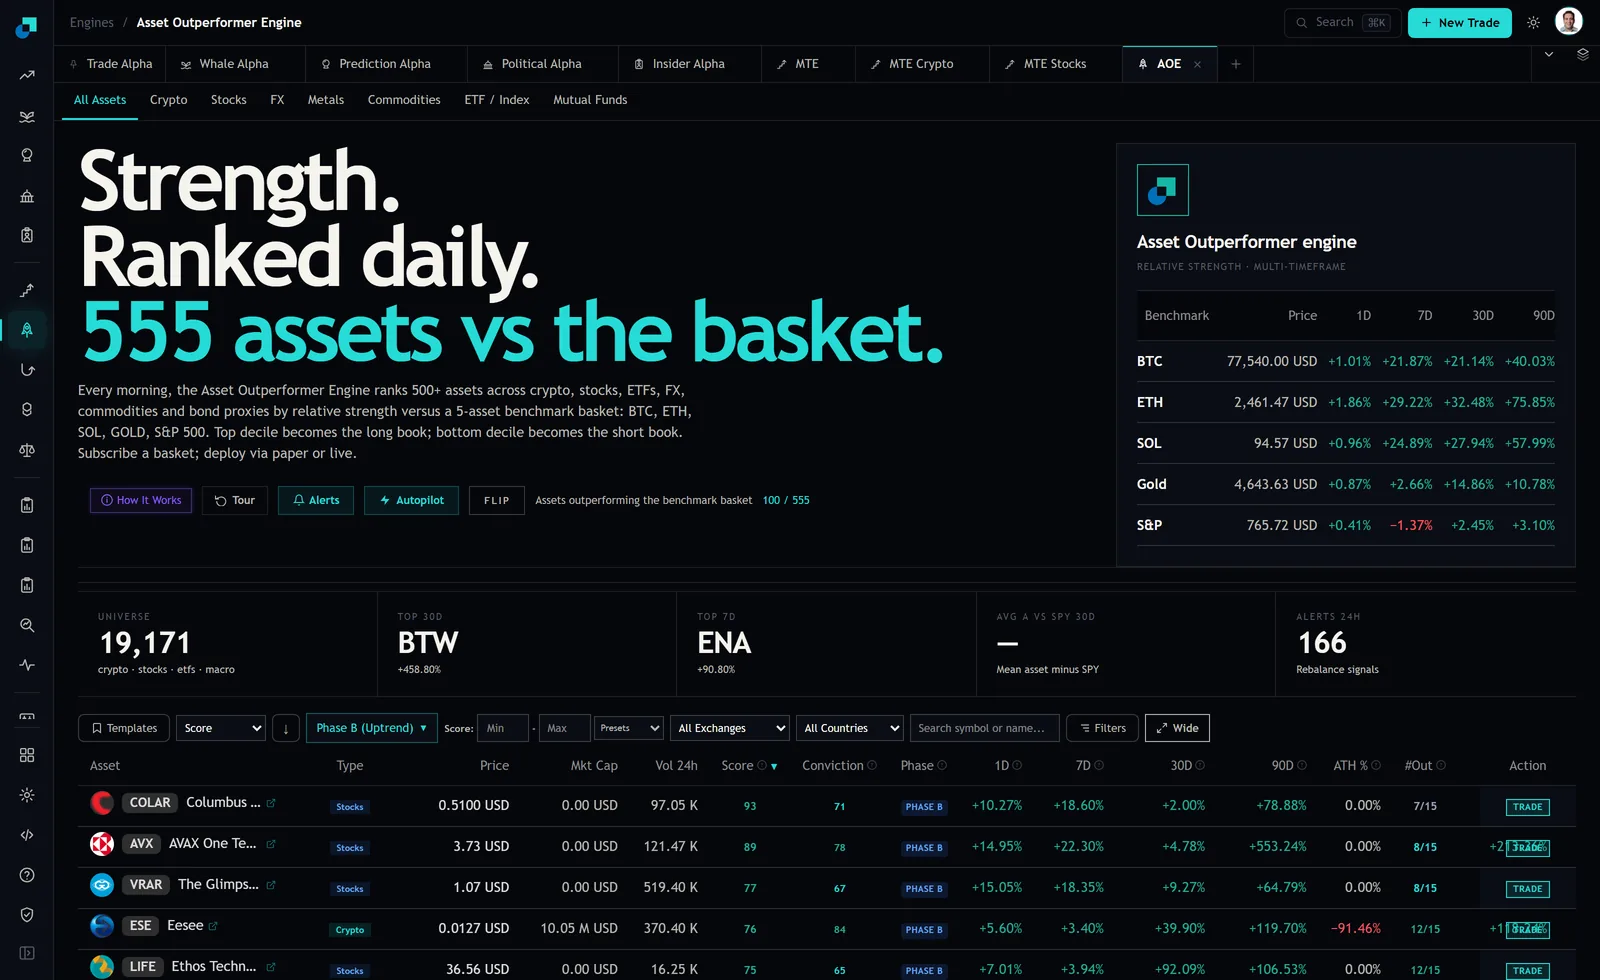
The trap is visible in that caption and it is worth stating flatly. On the capture, the control above the table is set to Phase B (Uptrend) and every visible row shows PHASE B. The uniformity is a consequence of the filter, not a reading of the market. An analyst who computes "share of names in uptrend" from the displayed list will get 100 percent every time, and will report a maximally bullish breadth signal on any tape whatsoever. Your overlay input has to be built from the unfiltered scored set for the specific constituents in your sleeve, and the filter state has to be part of the signal definition you file, alongside the classifier setting and the composition of the benchmark basket.
The second thing that caption records is what is missing. The tile labelled as the mean asset minus SPY over 30 days is blank on this capture. That is the single vendor aggregate that maps most directly onto an overlay decision, and it is not populated. Build your own breadth series from the constituents you actually hold rather than depending on a header tile, and you will not be exposed to it disappearing.
The capacity problem sitting at the top of the ranking
Before designing the tilt, look at what the ranking is actually pointing at. On the capture, the top-scored asset is Columbus Acquisition Corp at 93, with a market cap cell reading 0.00 USD and 24-hour volume reading 97.05 K. Ethos Technologies scores 75 with volume of 16.25 K. These are not names a desk can express a sleeve tilt in. At any institutional size you are the market in them, and the round trip alone would consume more than the tilt could plausibly add.
This is the structural reason the engine's own framing does not transfer to an overlay. Implementing the top decile literally means accepting whatever liquidity profile it happens to have that week, and here that is microcaps. An overlay solves it by moving up a level: use the board to decide direction and magnitude at the sleeve level, then implement with the liquid instruments your desk already trades. The signal answers whether to sit at the top or the bottom of the equity band. It does not have to pick the names, and the moment it does you have inherited a capacity constraint that has nothing to do with whether relative strength works.
The benchmark panel at the top right is more useful to an overlay than the ranking table for exactly this reason. On the capture it showed the S&P at minus 1.37 percent over seven days while ETH ran +29.22 percent and BTC +21.87 percent, with gold at +2.66 percent. Five liquid reference assets, four timeframes each, and a cross-asset picture you can implement at size. Note what a relative-strength tilt would have said at that moment: maximum digital, minimum equity. That is precisely the configuration where band discipline earns its existence, and it is worth noticing that three of the five benchmark assets are crypto, which shapes what the ranking treats as a high bar to clear.
Sizing a tilt to a tracking error ceiling
Bands cap the tilt in weight space. The risk budget caps it in risk space, and the second constraint is the one that binds, because 500 basis points of digital assets and 500 basis points of investment grade credit are not the same amount of active risk by any measure.
Set the ceiling as a number in the mandate: an overlay tracking error of, say, 150 basis points against the policy benchmark, measured ex ante on the current tilt and reported ex post each month. Then solve backwards. Given your covariance estimates, the ex ante figure tells you what fraction of each band the tilt is allowed to use, and a high volatility sleeve will hit the ceiling well before it hits its weight band. This is what stops the overlay quietly becoming a crypto strategy in a strong crypto tape, which, on the readings above, is what an unconstrained relative-strength tilt would have produced.
Cadence is the other half of sizing. The engine runs a full scan every six hours and the alerts tile read 166 rebalance signals in 24 hours. An overlay must not run at that frequency. Pick a review cadence the governance can support, monthly is usually right for a policy mix, and define one between-meeting trigger with a numeric threshold, so an intra-month move is either large enough to act on by a pre-agreed rule or it waits. Turnover at signal cadence will spend the entire budget on implementation, and the fastest way to lose an overlay mandate is a cost line that exceeds the tilt's contribution.
The reporting line, and the sentence you say when it goes wrong
The overlay needs its own row in performance attribution, separate from policy and from manager selection. Three numbers, monthly: the ex ante tracking error the tilt carried, the return contribution of the deviations from policy weights, and the implementation cost of getting into and out of them. Report all three even in months where the contribution is negative, and particularly in months where it is positive, because an overlay that is only shown when it works has no credibility left when it stops.
Store what the signal said and when, not just what you did. Which phase state each sleeve's constituents were in, the filter and classifier settings in force, the composition of the benchmark basket at the time, and the date and hour you read the board given the six-hour scan cycle. Reconstructing a decision eighteen months later from a board that has since rescanned two thousand times is otherwise impossible, and the inability to reconstruct it is what turns a bad quarter into a governance problem.
The sentence you want to be able to say in the review is narrow and boring, and it should be true before the quarter starts rather than composed afterwards. The overlay was permitted to move sleeve weights within approved bands, it used a defined fraction of a stated tracking error budget, the tilt it carried was recorded before the outcome was known, and here is what it cost and what it contributed. That is a process someone can disagree with. It is not a process someone can call undisciplined, and the difference between those two is usually what determines whether an overlay survives its first bad year.