A correlation matrix ranks pairs. You do not own pairs, you own positions, and the question you actually want answered is which single holding is doing the most to make your portfolio one bet instead of five. The matrix contains that answer but does not present it, because it has no idea what you own.
Adding your position sizes turns the grid into a ranked list with a name at the top. The arithmetic is two columns in a spreadsheet, and the output is a decision you can make this week rather than a general lesson about diversification.
Why the raw matrix cannot answer the question
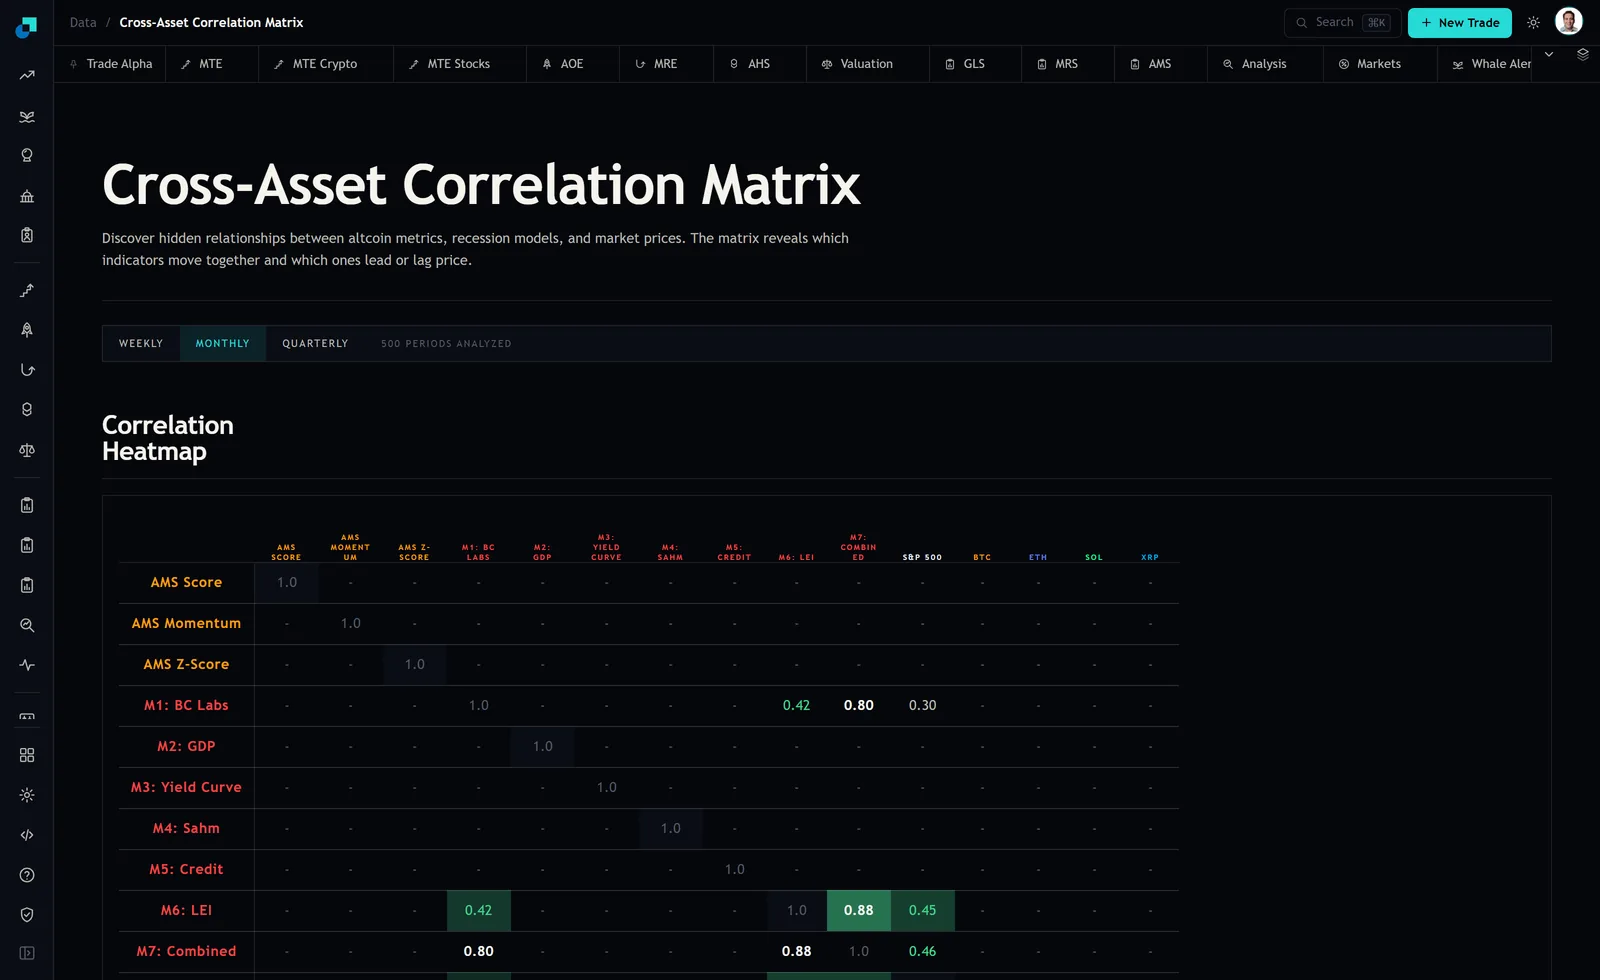
At the time of writing the Cross-Asset Correlation Matrix was on its MONTHLY window with 500 periods analyzed, showing fifteen rows across altcoin scorecard metrics, recession models, the S&P 500, and BTC, ETH, SOL and XRP. Six of the 105 unique pairs carried a coefficient, the rest showed dashes.
Suppose every cell were populated. The highest coefficient on the grid would tell you which two things move together most tightly. That is not the same as telling you which of your holdings is the problem. A pair correlated at 0.9 where you hold $200 of each is irrelevant. A pair correlated at 0.6 where you hold $6,000 of one and $4,500 of the other is most of your risk. The matrix ranks relationships. You need to rank dollars.
The two column calculation
Work through a concrete book. Say $20,000 total, held as $6,000 BTC, $4,500 ETH, $3,000 SOL, $1,500 XRP and $5,000 in an S&P 500 index fund. As weights that is 30, 22.5, 15, 7.5 and 25 percent.
Now suppose the cells read as follows. BTC against ETH 0.82, BTC against SOL 0.74, BTC against XRP 0.61, BTC against the index 0.38, ETH against SOL 0.79, ETH against XRP 0.63, ETH against the index 0.35, SOL against XRP 0.58, SOL against the index 0.31, XRP against the index 0.24.
For each holding, multiply its weight by the sum of every other holding's weight times the correlation between them. BTC scores 0.131, ETH 0.112, SOL 0.078, the index fund 0.064 and XRP 0.035. Multiply by the $20,000 book to read them in money and BTC contributes about $2,618 of correlated exposure, ETH about $2,247, SOL about $1,562, the index fund about $1,286 and XRP about $708.
There is your ranking, and BTC sits at the top of it.
One more view is worth computing while the numbers are in front of you, which is each holding's share of total portfolio risk rather than its share of dollars. On this book BTC takes 30 percent of the money and 33.9 percent of the risk. ETH takes 22.5 percent of the money and 25 percent of the risk. The index fund takes 25 percent of the money and only 19.4 percent of the risk, and XRP takes 7.5 percent of the money and 6.3 percent of the risk. Every crypto holding is punching above its dollar weight and the index fund is punching below, which is the correlation structure showing up in the only currency that matters.
The trap in that ranking
BTC is at the top partly because it is the biggest position, which is not news and not actionable. A ranking that just recovers your position sizes is a waste of an afternoon. So run the second version.
Divide each holding's score by its own weight. That strips out size and leaves the average correlation of that holding to everything else you own. On the same numbers ETH comes out at 0.64, BTC at 0.62, SOL at 0.61, XRP at 0.51 and the index fund at 0.34.
The order changed. ETH is the most entangled holding per dollar, not BTC. And the spread between the top three is tiny, which is the real finding. BTC, ETH and SOL are effectively interchangeable from a diversification standpoint. Holding all three is holding one position with three tickers on it, and the only genuine diversifier in the book is the index fund at 0.34.
Read both columns. The first tells you where the risk is concentrated in dollars. The second tells you which holding is structurally redundant. They usually point at different names, and the second one is the one you did not already know.
Testing the trim before you place it
Ranking is not a decision. The decision is what to sell, so test it before you touch anything.
Take $1,500 out of one holding and move it to cash, then recompute the portfolio's volatility. On the book above, taking $1,500 from BTC lowers it by 8.4 percent. From ETH, 8.2 percent. From SOL, 7.6 percent. From XRP, 6.0 percent. From the index fund, 5.6 percent.
Notice how flat that is. The gap between the best and worst trim is under three percentage points of portfolio volatility, and the top three options are within half a point of each other. Which means the correlation ranking, having done its job of identifying the crowded block, cannot tell you which of BTC, ETH or SOL to cut. It genuinely does not matter much, and anyone who tells you the matrix picked one is over-reading it.
That is a liberating result rather than a disappointing one. Since the risk reduction is nearly identical whichever of the three you trim, choose on grounds the matrix knows nothing about. Which has the worst spread and fees to exit. Which has a tax lot you would rather not realise. Which one you hold for reasons you can still articulate. The matrix narrowed five candidates to three and then handed the decision back to you, which is exactly as far as a correlation number should ever be trusted.
Running it on your own book without a full matrix
The obstacle in practice is the dashes. If most of the cells you need are empty, the weighted ranking cannot be computed, and filling the gaps with zeros is worse than useless because it will rank your unmeasured holdings as your best diversifiers.
Two workarounds. First, read the same pairs on the weekly, monthly and quarterly toggles, since coverage differs between them and a cell that is empty on one is sometimes populated on another. Second, group rather than list. If four of your holdings are crypto and the matrix cannot price them against each other, treat them as one block at a high assumed internal correlation and rank blocks instead of names. It is coarser and it will still find the concentration, because concentration at the block level is where the damage lives anyway.
Recompute after any trade that changes a position by more than a few percent of the book, and at least once a quarter regardless. The weights move with prices even when you do nothing, and a winner that has run has quietly promoted itself to the top of the ranking without ever appearing in your trade history.