Venue concentration in a data source is usually filed as a coverage note, somewhere in an appendix, phrased as a limitation. It belongs in the risk register instead, because a research process whose signal supply, historical sample and live triggers all terminate at one venue has taken a counterparty position whether or not anyone wrote it down as one.
The Whale Alpha Statistics tab makes the case unusually cleanly, and the arithmetic that proves it takes about two minutes and produces a dated artefact you can put in a file.
One bar, and a category panel that proves it
The Platform Distribution panel, charted by volume, showed a single bar labelled $249.2M at capture. Nothing else in that panel carried a value.
On its own, one visible bar is suggestive rather than conclusive, since bars can be too short to render. The panel next to it settles the question. Category Distribution, also by volume, showed five bars reading $124.8M, $57.8M, $51.4M, $8.7M and $6.5M. Add them up and you get $249.2M, exactly the platform bar.
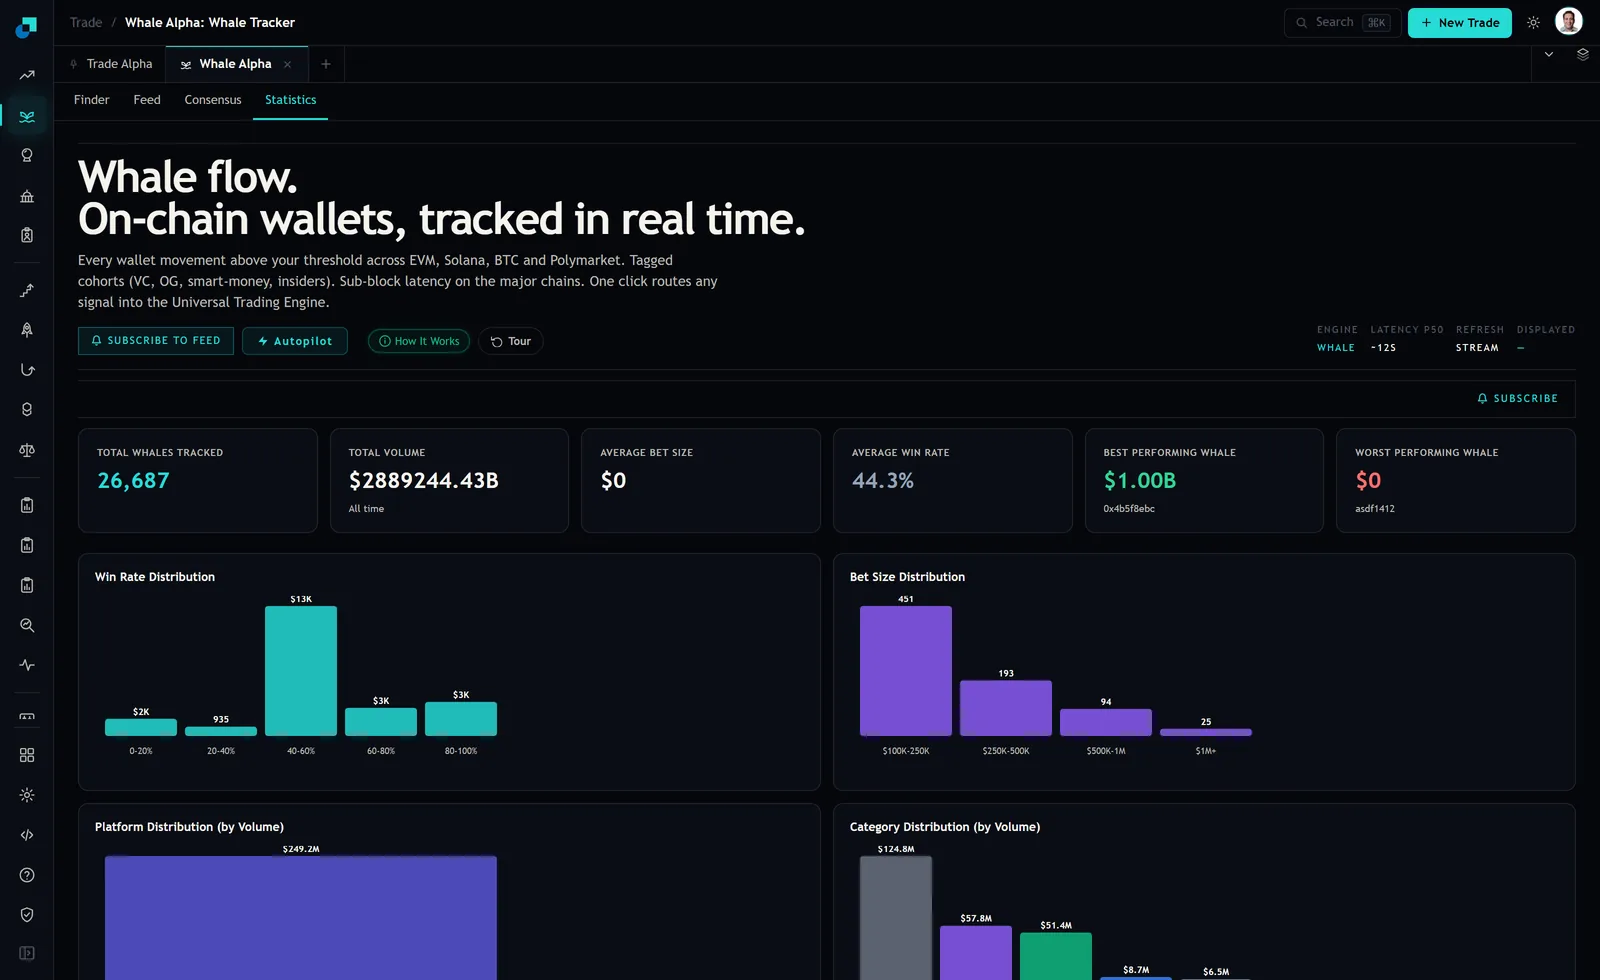
The categories are a partition of the tracked volume, so if they exhaust the platform bar then the platform bar exhausts the dataset. This is not high concentration. It is total, and it is verifiable from two panels sitting side by side.
Three exposures behind one venue
Separate them, because they have different owners and different mitigations, and firms routinely mitigate one and believe they have covered all three.
Trading counterparty exposure is the obvious one and only applies if you execute at the venue. Margin, custody of collateral, settlement finality, and the ordinary questions you would ask of any counterparty, sized against your own books.
Data continuity exposure applies whether or not you execute there. If the venue changes its API, restricts access by jurisdiction, alters its fee or listing policy, or simply goes down for a week, your signal supply stops. Every strategy downstream of that feed is affected simultaneously, which is the property that makes it a concentration rather than a set of independent risks.
Model exposure is the one that gets missed. A model fitted on one venue's data has learned that venue's microstructure, its participant mix, its tick and fee conventions and its resolution behaviour. Whether it generalises to a second venue is an empirical question nobody has asked, and the answer arrives at the worst time, which is when you are forced onto a second venue because the first one became unavailable.
Why you should not express this as a percentage
The natural instinct is to compute a share, one venue over total volume, and put a number in the register. Resist it here, because the denominator on offer is not sound.
The tile row above those charts read Total Whales Tracked 26,687, Total Volume $2889244.43B all time, Average Bet Size $0, and Average Win Rate 44.3%. A total volume in the thousands of trillions and an average bet size of zero cannot both describe the same 26,687 wallets, and neither can sit alongside a charted volume of $249.2M without something in the aggregation being wrong.
The right response to an implausible tile is not to reach for the plausible one, and it is certainly not to treat the implausible figure as a finding. It is to stop deriving anything from that row of cells and fall back to the statement you can actually defend, which is the qualitative one the two panels support: the charted whale volume sits on a single platform. That is sufficient to write a limit, and it has the advantage of being true.
Record it that way in the register too. A qualitative statement with a reproducible test behind it survives scrutiny better than a precise percentage derived from a cell that a competent reviewer will immediately question.
Limits that do not need a working denominator
Three limits, each expressed in quantities you own rather than quantities the vendor publishes.
- A venue exposure cap, in your notional and your posted margin at that venue, as a fraction of firm capital. Sized off your books, reviewed on your cycle, entirely independent of the vendor's aggregates.
- A signal dependence cap, being the maximum fraction of live strategies whose entry trigger depends on a single venue's data. Pair it with a named and tested fallback source per strategy. Identified is not tested, and the difference between the two only becomes apparent on the day you need it.
- A continuity clause, being the maximum number of trading days a strategy may continue running after its source stops updating, together with who is authorised to extend that and what evidence they need. Staleness tolerances that exist only as an assumption default to infinity in practice.
Note what none of these require. No percentage, no vendor aggregate, no reliance on a tile. They are limits on your own behaviour, which is the only thing a limit can actually constrain.
Tracker concentration and market concentration are different risks
One distinction that changes which of the three exposures you are actually carrying, and it is worth putting to the vendor in writing.
A panel like this charts the volume of wallets the platform has chosen to track. That is not a census of the market. The module's own whale feed, when it returned no rows at capture, explained that its data is built from tracked Polymarket wallets with large positions. If the tracking universe is itself venue-shaped, then the concentration you are measuring is partly a property of the tracker rather than of the underlying market.
That distinction is not academic. Tracker-side concentration is a data continuity and model risk, and it is fixable by adding sources. Market-side concentration is additionally a counterparty and liquidity risk, and adding data sources does nothing about it. Ask which one the panel reflects, get the answer in writing, and record it with a date, because it will change as the vendor expands coverage and your register should change with it.
The quarterly two-minute test
Make the check repeatable so it becomes evidence rather than an anecdote from the week somebody happened to look.
Open the Statistics tab. Capture the Platform Distribution and Category Distribution panels. Record the labelled bar values from each. Verify whether the category bars still sum to the platform total, since that is the test that upgrades one visible bar into a demonstration. Note the tile values alongside, including the ones that look wrong, because the persistence of a broken aggregate across quarters is itself a data quality signal worth tracking. Date it, initial it, file it.
Two minutes a quarter buys a time series showing whether concentration is improving, static or worsening, built from panels rather than from assurances. When the question comes up in a review, and it will come up in the review where something went wrong rather than the one where everything was fine, the answer is a folder rather than a recollection.