The Statistics view reported a best performing whale at one billion dollars against the address 0x4b5f8ebc, and a worst performing whale at zero, across a census of 26,687 tracked wallets. Both are real readings and both are close to uninformative for manager selection, for the same reason: a total dollar figure is a joint statement about skill and about how much money the wallet had to deploy, and it does not tell you which of the two you are looking at.
This is the same problem an allocator already knows how to handle in traditional manager selection, where nobody ranks funds by absolute profit. It gets forgotten on chain because the data arrives pre sorted by a dollar column and the sort feels authoritative.
A dollar ranking is a capital ranking with a skill label
Put it formally for one second, because the formality is the point. Total PnL is homogeneous of degree one in deployed capital. Double the book and hold the strategy constant and the dollar figure doubles, with no change in the quality of a single decision. Any ranking built on a quantity with that property is dominated by capital dispersion whenever capital dispersion is wide, and across 26,687 wallets spanning DEX perpetuals and prediction market participants, capital dispersion is enormous.
The practical consequence is that a dollar PnL leaderboard answers the question "who has the largest book and did not blow it up". That is a genuine question, and if what you need is a list of counterparties large enough to matter to liquidity, it is exactly the right sort. It is the wrong sort for the question an allocator is usually asking, which is whose process would you want to own a scaled down version of.
A scale invariant statistic asks the second question. Divide return by the volatility of return and the capital term cancels. A wallet running a hundred thousand dollars and a wallet running a hundred million can be compared directly, and the one with the better ratio is the better process regardless of which has the bigger dollar figure. That cancellation is the entire reason risk adjusted ranking exists.
Building the ratio from what the module publishes
Whale Alpha states its ranking inputs explicitly, and they are the raw material rather than the finished ratio. Realised PnL across the selected period. Win rate and average return per trade. Risk classification flagging concentration, leverage and drawdown profile. Holding period distribution and trade frequency. Cross venue aggregate exposure. Sentiment score from current open position skew.
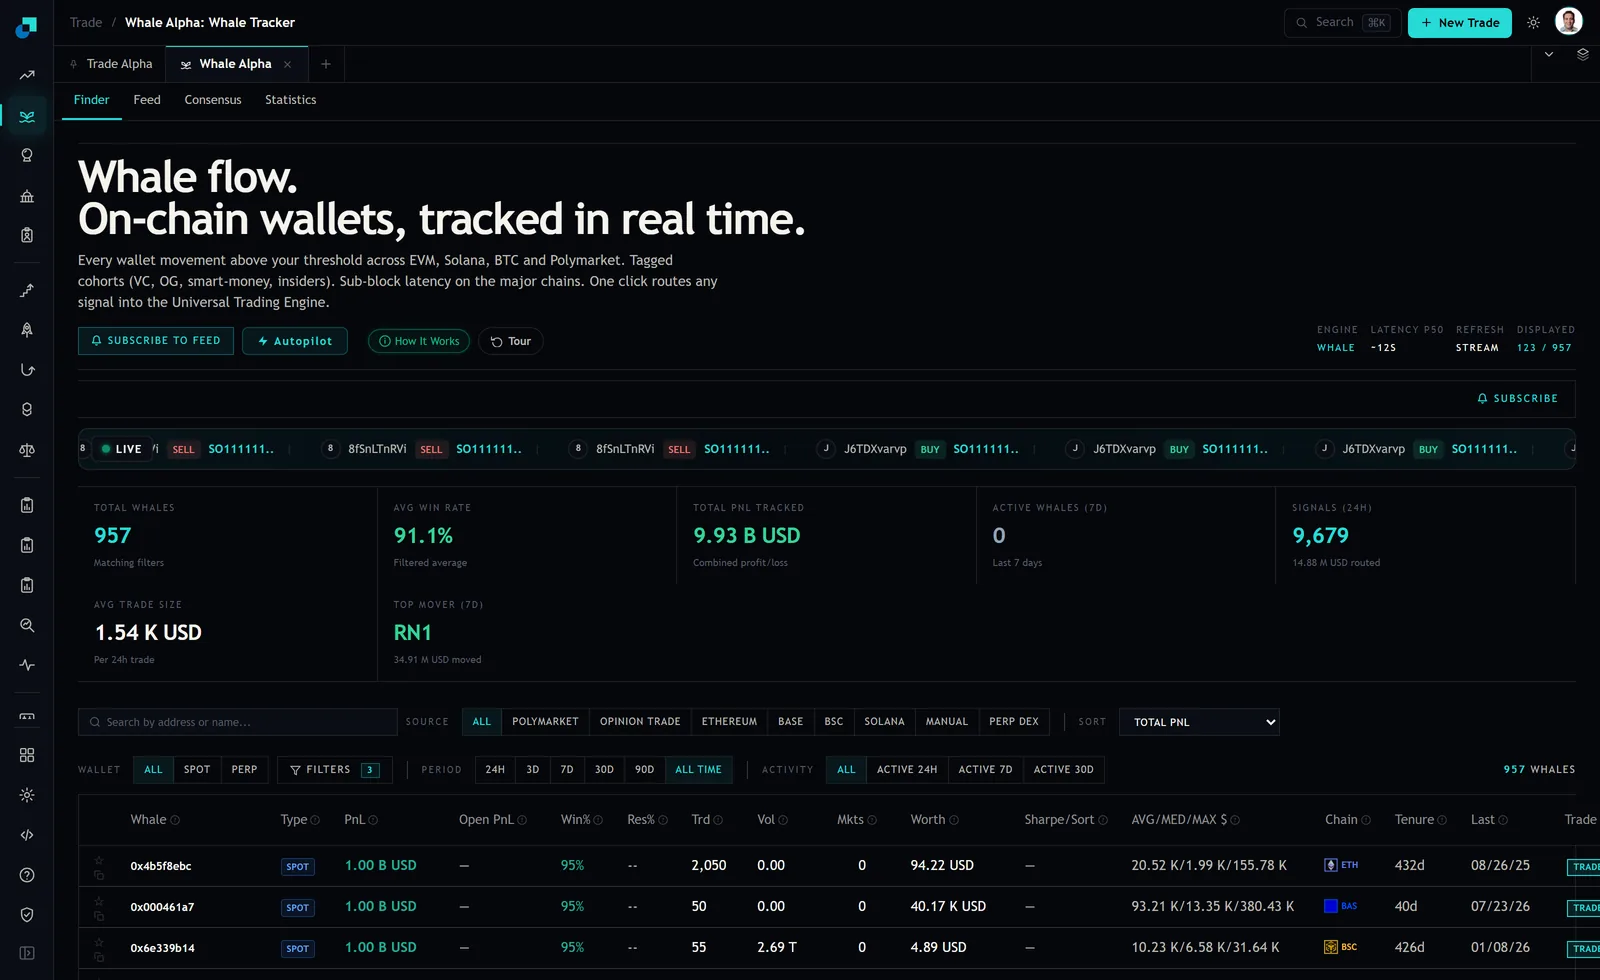
Average return per trade is the numerator you need. Trade frequency and holding period distribution let you annualise it consistently across wallets that trade at wildly different tempos, which matters because a per trade figure from a wallet holding for six hours and one holding for six weeks are not the same unit. The denominator is dispersion of per trade returns, which you compute from the trade series rather than read off a tile.
If your view does not expose a ready made ratio column, this is a twenty line computation over an exported trade history, and doing it yourself has a side benefit worth the effort. You control the annualisation convention, the treatment of open positions, and whether funding is inside or outside the return, and you can state all three when somebody asks why your ranking disagrees with the screen.
Measuring how much the ranking actually moves
Do not take my word for the size of the effect, and do not take anybody else's. Measure it on your own filtered universe, because the answer depends entirely on how wide the capital dispersion is inside your particular slice.
- Freeze a filtered cohort and a period. Export the trade level history for every wallet in it.
- Produce two ranked lists over the identical data. One ordered by total realised PnL, one by your risk adjusted statistic.
- Count the overlap in the top twenty of each, and record it as a plain count out of twenty. Repeat over several non overlapping periods so you can see whether the overlap is stable or itself noisy.
- For every wallet that appears in one list and not the other, note its deployed capital. The pattern in that column is the finding, and it is usually visible without any statistics at all.
The mechanism to expect is straightforward. Wallets that appear only on the dollar list are large. Wallets that appear only on the risk adjusted list are small and consistent. The wider the capital dispersion in your cohort, the less the two lists have in common, and if they turn out to agree almost completely then your filter has already removed the capital dispersion and you can stop worrying about it. Either outcome is worth knowing and neither can be assumed.
Where the ratio misleads, and it does
Switching the sort does not end the problem, it moves it, and a selection process that treats a risk adjusted number as a final answer will find new ways to be wrong.
Short samples are the first issue. A ratio computed over a small number of trades is dominated by luck, and a wallet with eleven fills can post a spectacular figure that means nothing. Impose a minimum trade count before a wallet is eligible to be ranked at all, and set it from the cohort's own frequency distribution rather than from habit.
Return asymmetry is the second and it is more dangerous, because it is systematic rather than random. Strategies that sell optionality, whether explicitly or through position management that lets losers run, produce long stretches of small steady gains and rare catastrophic losses. Over a window that does not contain the catastrophe, they rank superbly on any volatility based measure. This is precisely what the risk classification field exists to catch, and it is why concentration and leverage flags should be read as a veto on a ranking rather than as another column to weight.
Third, the denominator is measured on realised trades. A wallet holding a large losing position that it refuses to close shows no volatility from that position at all until the day it closes it. Cross venue aggregate exposure is the field that lets you see what is still open, and a ranking that ignores open risk is ranking wallets on the trades they chose to finish.
Keeping both columns, and saying which one you used
The workable arrangement is to run both and let each do its own job. The dollar ranking identifies wallets whose flow is large enough to matter for market impact and for the liquidity assumptions underneath any capacity work. The risk adjusted ranking identifies processes worth replicating. A wallet that appears high on both is genuinely interesting. A wallet high on dollars alone is a liquidity fact. A wallet high on the ratio alone is a candidate whose capacity you now have to establish separately, because nothing in a scale invariant statistic tells you the strategy survives being funded.
Then state the choice in the research note, with the annualisation convention, the minimum trade count, the treatment of open positions and the cohort filter written next to it. A ranking with undocumented construction is not a ranking a committee can interrogate, and the first question will always be whether the list would look different sorted the other way. Having already measured the overlap yourself is a considerably better answer than finding out in the meeting.