The combined score on the Macroeconomic Risk Scorecard reads 29 out of 100, and the label underneath it says what it is: a zero to one hundred recession risk. That is a statement about odds. It is not a statement about size, and the gap between those two things is where a lot of retail portfolios quietly take damage they did not plan for.
Two recessions with identical probabilities beforehand can do completely different things to your account. One is a couple of soft quarters where equities dip and recover inside a year. The other is the kind where the thing you own most of falls seventy percent and takes four years to come back. The scorecard is estimating how likely a downturn is. Nothing on that tile row is estimating how far your specific holdings fall if one arrives.
The number on the tile answers one of two questions
Any risk you actually care about has two components multiplied together. How likely is the bad thing, and how much do I lose when it happens. Insurance pricing works this way, engineering works this way, and portfolio risk works this way.
The scorecard is genuinely good at the first component. Seven independent recession probability models over more than fifty macroeconomic indicators, from FRED, the BLS, the BEA and the ECB, is a serious attempt at the odds question. But the second component is not a macroeconomic quantity at all. It is a property of what you own. A composite built from Treasury yields, inflation prints, credit spreads and the dollar index has no way of knowing that sixty percent of your account is in one sector.
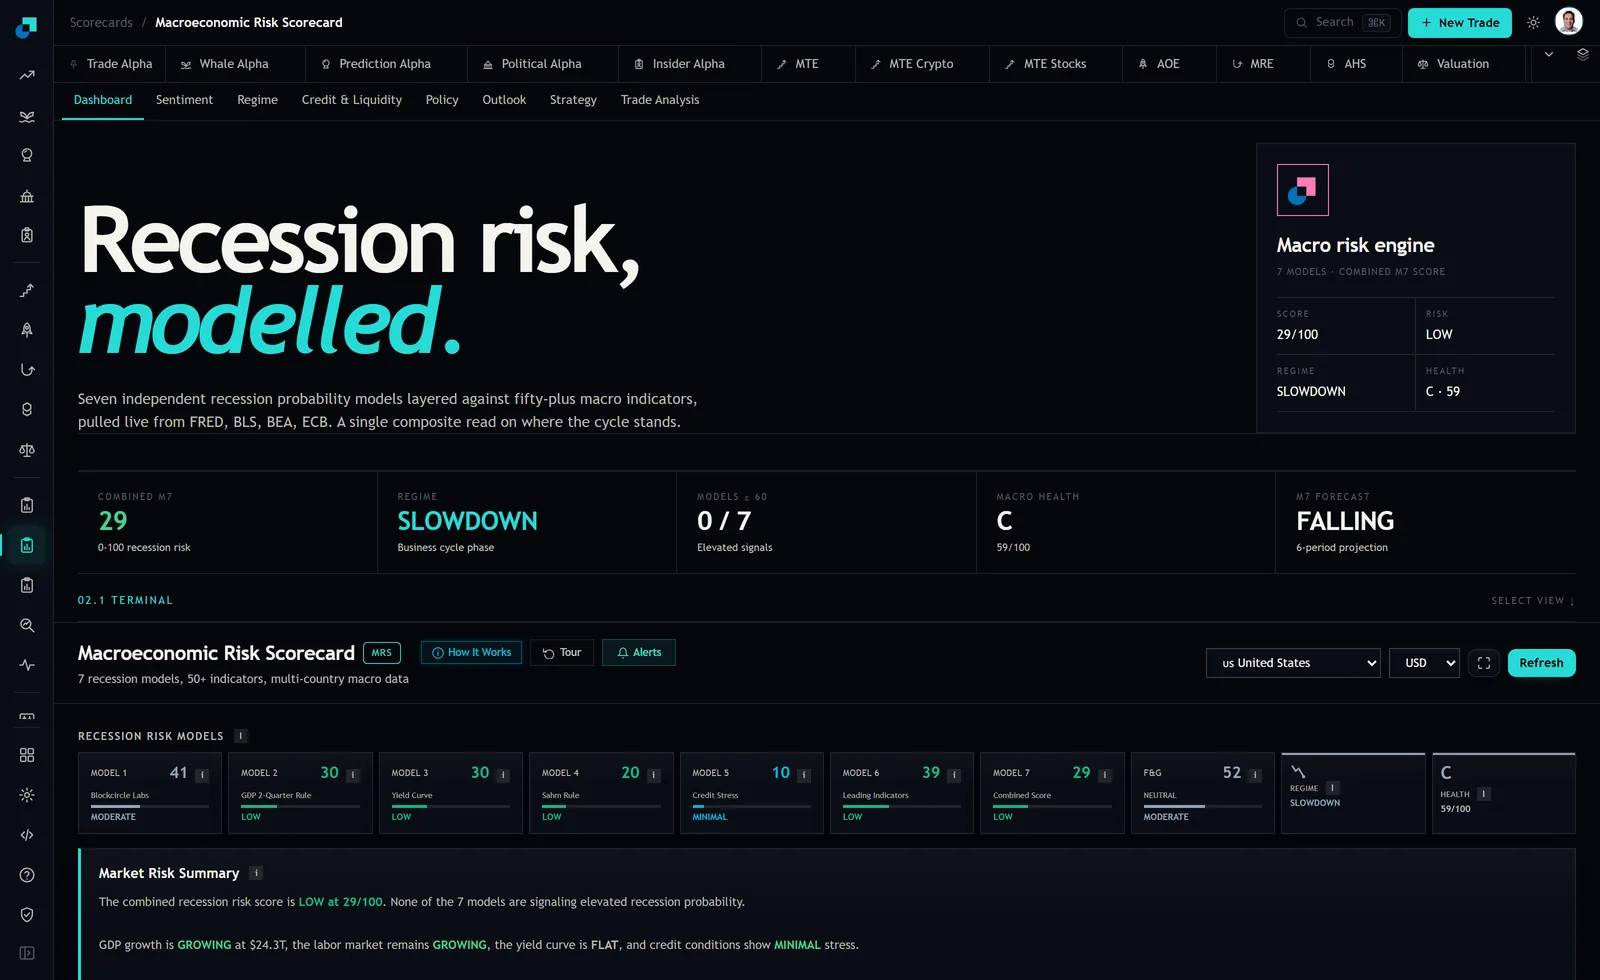
This is not a criticism of the module. It is a criticism of how the number gets used. A low probability reading gets treated as a general all clear, when the only honest reading is that one of the two inputs to your risk is currently low and the other one is whatever you have made it.
Two accounts, one reading, different outcomes
Take two people looking at the same 29 this morning. Both have thirty thousand dollars.
The first holds twenty one thousand in a single high-beta theme, four thousand in a broad index fund, three thousand in a large cap crypto position, and two thousand in cash. The second holds fifteen thousand in a broad index fund, six thousand in short-duration bonds, three thousand in the same crypto position, and six thousand in cash.
Now apply a moderate downturn, and be deliberately unambitious about the numbers. Broad equities down twenty five percent, a concentrated high-beta theme down fifty, crypto down sixty, short bonds roughly flat.
- The first account: the theme position falls to ten thousand five hundred, the index fund to three thousand, the crypto to one thousand two hundred. Total account, with cash, about sixteen thousand seven hundred. Down roughly forty four percent.
- The second account: the index fund falls to eleven thousand two hundred and fifty, bonds hold near six thousand, crypto falls to one thousand two hundred. Total, with cash, about twenty four thousand four hundred. Down roughly nineteen percent.
Same macro reading, same event, and one person has lost more than twice as much as the other. The scorecard could not have distinguished between them, because the difference was never in the macro data. It was in the position sizing, which is the half of the problem that is entirely inside your control and the half that no dashboard can compute for you.
The recovery arithmetic is the part that bites
Depth matters more than most people intuit because the loss and the recovery are not symmetric. A position down twenty five percent needs to rise about thirty three percent to get back. Down forty four percent needs about seventy nine percent. Down sixty percent needs one hundred and fifty percent.
So the difference between the two accounts above is not a difference in this year's return. The first account now needs the sort of move that takes years, and it needs it while the holder is watching, which is where the behavioural failure comes in. People do not usually sell at the bottom because they changed their mind about the thesis. They sell because the dollar amount got large enough to interfere with sleep, and the dollar amount got large enough because the position was sized against a probability estimate rather than against a loss they had actually imagined.
Compute your own severity number this week
It takes about twenty minutes and it is the single most useful thing on this page.
- List every holding with its current dollar value. Not percentages, dollars, because dollars are what you feel.
- Next to each, write a plausible peak to trough decline for that kind of asset in a real downturn. Broad equity indices, a quarter to a third. Concentrated single-theme or small cap exposure, half. Crypto, more than half. Short-dated bonds and cash, near zero. You are not forecasting, you are choosing a number you would not be shocked by.
- Multiply and sum. That total is your severity number.
- Divide it by your total account. That percentage is what you are actually exposed to, and it is entirely independent of whether the scorecard reads 29 or 71.
Then ask the only question that matters: if that number arrived over the next twelve months, would I still be holding at the bottom, and would my life outside the account still work. If the answer to either is no, the fix is to change the sizing now, while prices are good and the change costs you spread rather than a realised loss.
What the scorecard is actually for in this workflow
Given all that, it would be easy to conclude the macro number is useless. It is not. It just belongs at a different step than most people put it.
Probability tells you how urgently to do the severity work, not how much to hold. At a reading of 29 with a regime label of SLOWDOWN, the honest interpretation is that the models mostly are not alarmed and the cycle phase is not expansion, which is a fine environment in which to do a calm, unforced review. If the score were high and climbing, the same review would be happening under time pressure, with worse prices, and with your own emotions in the room.
The other tabs are more useful for the depth question than the headline number is, and it is worth knowing why. Credit and liquidity conditions, and policy settings, speak to how much room there is for a downturn to be cushioned or amplified. They still will not hand you a depth forecast, because nobody has one, but they are at least about the mechanism rather than the odds. Read them as context for your own arithmetic, and let the arithmetic decide the sizing.