Read enough client notes and you learn to spot the sentence that means nobody looked. "The altcoin regime score softened over the week." Softened how, and because of what. The reader cannot tell whether leverage came out of the market, whether stablecoins left, or whether the whole move is one valuation ratio drifting inside its normal range. Neither, usually, can the person who wrote it.
The alternative is a contribution decomposition. Say which input moved, by how much, and in which direction, so that the reader can disagree with you specifically. What follows is how to build one against Blockcircle's Altcoin Market Scorecard given what the module exposes, including the part where the exact decomposition is not available to you and you have to say so.
The decomposition you want, and the one you can actually build
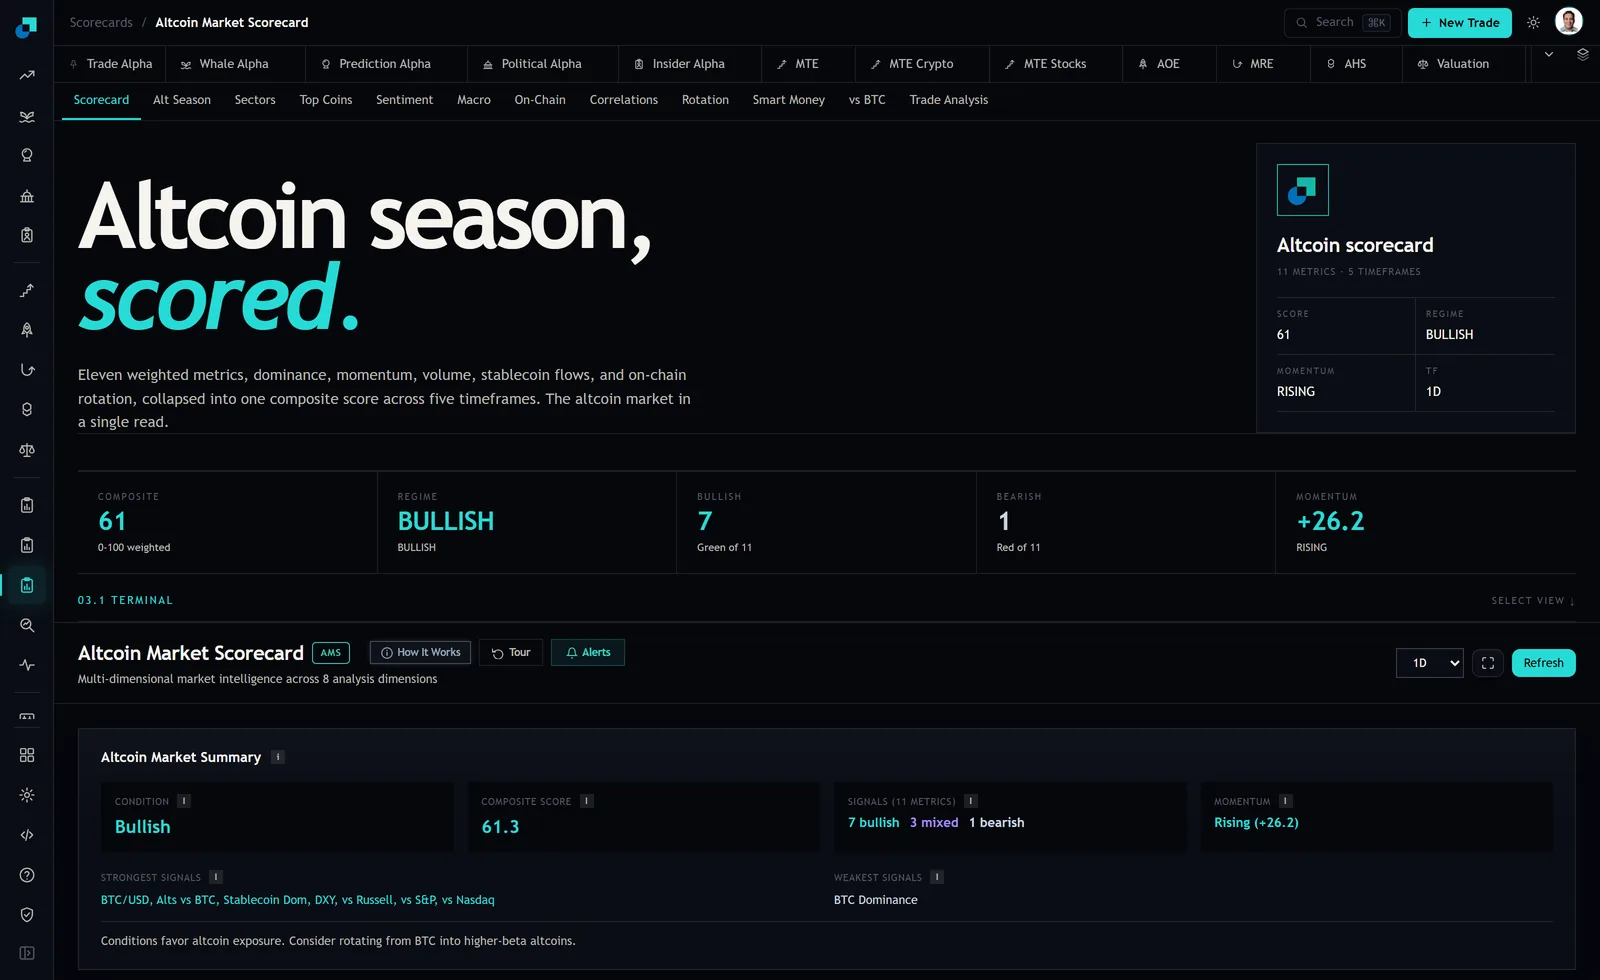
The composite is a weighted 0-100 score across eleven market metrics. The exact contribution of any input to a week-over-week change is the product of that input's weight and the change in its normalised value. Two of those three quantities are visible to you. The weights are not something I can read off the panel, and I am not going to guess at them, because a decomposition built on invented weights is worse than no decomposition at all. It has the same shape as evidence.
So build the version you can defend. Capture the composite and every tab-level reading you can see on a fixed schedule. Record direction and magnitude for each input week over week. Then rank the inputs by how far each one moved relative to its own recent range, expressed in standard deviations of its weekly change over the trailing year, rather than in its raw units. That gives you a ranking of candidate drivers that does not require the weights, because an input that barely moved cannot have driven the composite regardless of what it is worth in the blend.
State the method in the note in one line. Something like: contributions are estimated from the direction and normalised magnitude of each input rather than from published weights, so the ranking is reliable and the percentages are not. A reader who works with models will trust you more for that sentence, not less.
Capture discipline is most of the job
Attribution across a weekly window is only as good as the two endpoints. Get the capture wrong and you are attributing your own timing noise to the market.
Fix the weekday and the hour, in a named timezone, and never move them. Crypto trades continuously, so there is no close to anchor to and the anchor has to be a convention you impose. Fix the timeframe field as well, since the module offers five and the composite is a different number on each. The screenshot was taken on 1D at a composite of 61 with a regime of BULLISH and momentum RISING, and a note comparing a 1D reading this week to a longer-timeframe reading last week is comparing two different series.
Capture more than the headline. The composite, the regime label, the momentum label, the timeframe, the capture timestamp, and then the readings from each dimension the module breaks out, which includes sectors, top coins, sentiment, macro, on-chain, correlations, rotation and smart money. Store it append-only. The single most common way this work dies is that someone keeps the current values in a spreadsheet that gets overwritten each week, and six months later there is no history to attribute anything against.
Group the eleven inputs into three families before you write anything
Metric-level attribution is noisy because individual inputs are correlated with each other and a small difference in normalisation reshuffles the ranking. Family-level attribution is far more robust and, more importantly, it is what a client actually wants to know.
| Family | Inputs | What a move in it means |
|---|---|---|
| Positioning | Funding Rates, Open Interest | Leverage entering or leaving. Fast, reversible, and the family most likely to be a head fake. |
| Flow and liquidity | Stablecoin Flows, Exchange Reserves, Altcoin Volume Ratio, Large Transaction Volume | Capital and coin physically moving. Slower to turn and harder to fake. |
| Valuation and dominance | BTC Dominance, USDT Dominance, NVT Ratio, MVRV Z-Score, Realized Cap Changes | Where the market sits against its own cost basis and internal allocation. Slowest of the three. |
Attribute to the family first, then name the input inside it if one clearly dominates. The reason to work this way is that the families have different half-lives, and the half-life is the part that matters for what the client should do. A composite move driven entirely by positioning can reverse within days. The same size of move driven by exchange reserves and realized cap changes reflects coins that have actually moved and will not unwind on a single squeeze.
Writing the sentence so it can be wrong
Suppose next week's capture comes in at 54 against the 61 in the screenshot, same weekday, same hour, same 1D timeframe. Here is the version to avoid, and it is the version most notes run: the altcoin regime score deteriorated over the week as market conditions weakened.
Here is the version to write instead. The composite fell seven points week over week on the 1D timeframe. Both positioning inputs moved against the score by more than two standard deviations of their weekly change, while the flow family was roughly unchanged and the valuation family drifted mildly positive. On that basis we read the fall as leverage leaving the market rather than capital leaving it, which is the less durable of the two, and we did not reduce the sleeve. If exchange reserves and stablecoin flows follow over the next fortnight, we will revise that reading and act on it.
Note what the second version does. It is specific enough to be wrong, it names the check that would falsify it, and it explains an action, including the decision not to act, which is the decision clients least often see explained. The claim is that the readings you cite moved the way you say they did, which is verifiable, and that your interpretation of them is reasonable, which is arguable. That is the correct division of labour in a client note.
An attribution log, or you will only remember the good calls
Keep the weekly attribution sentences in a log with the readings that generated them. This costs nothing and it is the only thing that stops the exercise from becoming a rhetorical habit.
Two reviews make it useful. Once a quarter, read back the sentences and mark each one against what the following weeks actually did, with a plain right or wrong rather than a paragraph of context. And once a year, count how often each family was named as the driver. If positioning is named in three quarters of your notes, either your normalisation is too sensitive to the fastest-moving inputs, which is the usual cause, or your capture is landing at an hour when derivatives markets are at their most active. Both are fixable, and neither is discoverable without the log.
The failure this catches is subtle and common. An attribution process that is never scored converges, without anyone intending it, on whichever explanation is easiest to write. The log makes the explanation compete with what happened next, which is the only opponent it should have.