The most common way to lose money with a sentiment gauge is to be right about the direction and wrong about the calendar. You see an extreme reading, you conclude the market is stretched, you act, and then the reading stays extreme for another three weeks while the price keeps going against you. Being early and being wrong feel identical from inside a losing position, and most people close before finding out which one they were.
The fix is not a better gauge. It is knowing, in advance, roughly how long readings like the one in front of you tend to stay where they are. That is a measurable property, and it is the single most useful thing you can know about a sentiment series.
Why nobody should hand you this number
I want to be direct about what this article will not do. It will not tell you that extremes last a specific number of days, because I would be making that up.
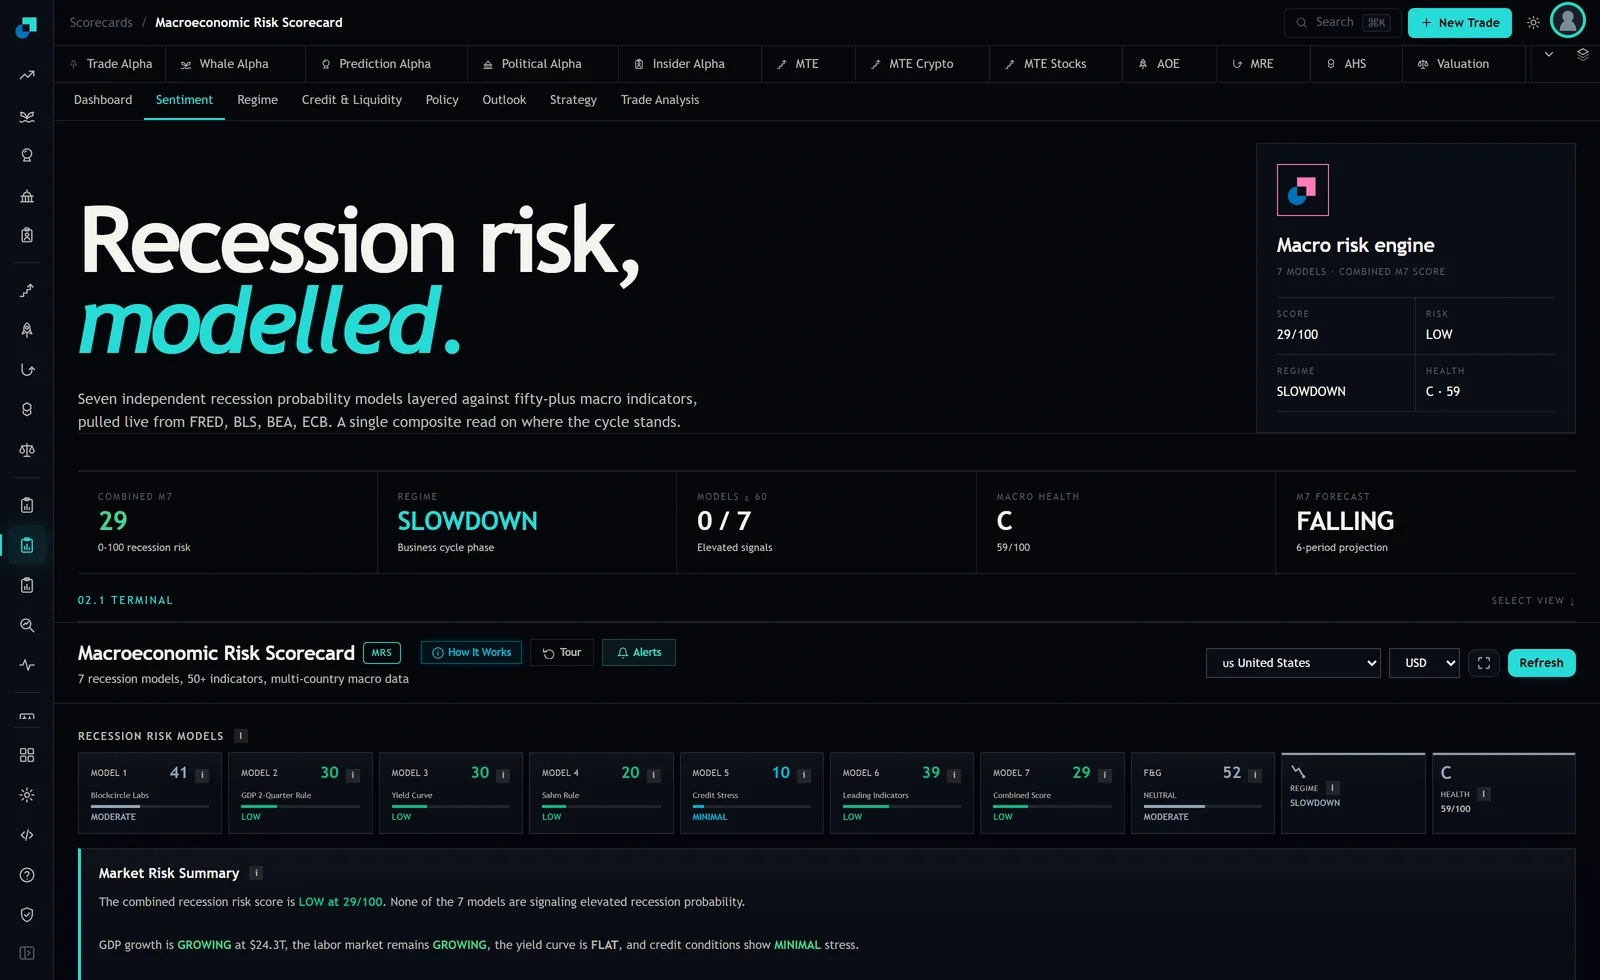
The capture in front of me shows the Sentiment tab of the Macro Risk Scorecard, with the fear and greed tile reading 52 and labelled NEUTRAL, sitting beside the seven recession model tiles and the header showing a combined M7 score of 29 out of 100. That is a live product reading current conditions. It is not a historical archive of past sentiment episodes with durations attached, and nothing visible on the page establishes how long any previous extreme ran.
There is a second reason, which survives even if you find a source that quotes a number. Persistence is not a constant. It depends on which series you are measuring, on how you defined extreme, on the horizon you care about, and on the period your sample covers. A figure quoted without those four things attached is decoration. A figure you measured yourself, with your own definitions, is a tool.
Measuring persistence properly, in one afternoon
The procedure is short and the details are where people go wrong, so read the details.
- Get the longest history of your chosen sentiment series that you can. Extremes are rare, so a two year sample will contain a handful of episodes and support no conclusion whatsoever.
- Define extreme before you look at anything, using a percentile of the history that came before each observation rather than of the full series. Using the full series lets the future leak into the past and inflates every result you will produce.
- Mark every episode: the day the series first crossed into your band, and the day it left. Do not merge two episodes separated by a brief exit, or rather, decide in advance how many days of exit ends an episode, and apply that rule mechanically to every case.
- Now you have a list of durations. Do not average them. Write down the shortest, the median, the seventy-fifth percentile, and the longest, and count how many episodes you have in total.
- Separately, and this is the step that matters most, record for each episode how far the price moved against a contrarian position between the day the band was first crossed and the day the episode ended. That is your actual drawdown, and it is the number that decides whether the trade is holdable.
The reason for not averaging is that duration distributions of this kind are lopsided. A handful of very long episodes sit alongside many short ones, so the mean lands somewhere no individual episode ever visited, and planning around it means being under-prepared for exactly the cases that hurt.
What the shape of the answer will look like
I cannot tell you your numbers, but I can tell you the shape you should expect, because it follows from the mechanism rather than from any dataset.
An extreme sentiment reading is a description of crowded positioning. Positioning unwinds when the people holding it are forced or persuaded to change, and that requires either a catalyst or exhaustion. Neither runs on a schedule. So the distribution of durations will have a lot of short episodes, where a catalyst arrived quickly, and a thin tail of long ones, where nothing did.
The practical implication is that your median duration is not the number to plan around. The seventy-fifth percentile is closer to a planning number, and the longest episode in your sample is the one to size against, because a sample of thirty episodes tells you very little about how long the thirty-first could run.
You should also expect the two ends of the range to behave differently. Fearful extremes tend to resolve faster and more violently than complacent ones, for the straightforward reason that forced selling is a mechanical process with an end point while complacency can simply continue. If your measurement shows that asymmetry, it is not a quirk of your sample.
Turning a duration distribution into a rule you can hold
Here is what changes in an actual account once you have the numbers.
First, you stop entering on day one. If your own measurement shows episodes routinely running for weeks, then acting on the first day of a crossing means committing capital at the start of the longest possible waiting period, with the maximum adverse move still ahead of you. Waiting until the series has been in the band for a while gives up some of the eventual move and removes a large share of the drawdown.
Second, you size against the tail rather than the median. Take the worst adverse move you recorded across your episodes, add a margin because your sample is small, and choose a position size where sitting through that move would be uncomfortable rather than ruinous. On a retail account this usually means the position is a third of what instinct suggested.
Third, you set the exit by time as well as by level. If your distribution says episodes rarely run past a certain length, then a position still open well past that point is evidence that this episode is in the tail, and the tail is where the assumption you traded on is least reliable. Closing on a calendar rule feels arbitrary and is far better than closing on a feeling.
The specific way this goes wrong
The failure I see most often is not analytical, it is sequencing. People discover the persistence problem while already in a losing contrarian position, and they respond by adding to it, reasoning that the extreme has become more extreme and therefore the case is stronger.
Sometimes that is true. The trouble is that it is indistinguishable, in the moment, from the case where the extreme is simply going to run longer than you can fund. Adding converts a position you could have held through the tail into one you cannot, which means you get stopped out by your own arithmetic rather than by the market being wrong.
The defence is to write the whole plan before entering: which band, how many days in the band before you act, what size, what adverse move you have decided you will sit through, and what date you close regardless. Then leave the gauge alone. A sentiment tile updates constantly and watching it hourly does nothing except erode a plan that was better than the version of you watching it.