Decoupling is the most reliably disappointing trade idea in crypto. The pitch is always the same. Someone notices that a token has stopped following Bitcoin, concludes that it is trading on its own fundamentals now, buys it as the diversifier the rest of the portfolio lacks, and then watches it fall in lockstep with everything else on the next bad Tuesday. The idea is not stupid. The measurement behind it is, and understanding why is worth more than any list of currently decoupled names.
Start with what the word is doing. Decoupled usually means one of three things, and people slide between them without noticing. It can mean the correlation over some recent window is low. It can mean the token went up while Bitcoin went down. Or it can mean the token has a demand source that genuinely does not depend on crypto beta. Only the third is a durable property. The first two are descriptions of a stretch of time that has already happened.
What the correlations panel shows and what it does not
The Correlations tab of the altcoin scorecard prints a Cross-Asset Correlation Matrix. On this capture it covers BTC, ETH, SOL, S&P 500, DXY and VIX, and the crypto square reads BTC to ETH 0.882, BTC to SOL 0.851, and ETH to SOL 0.859.
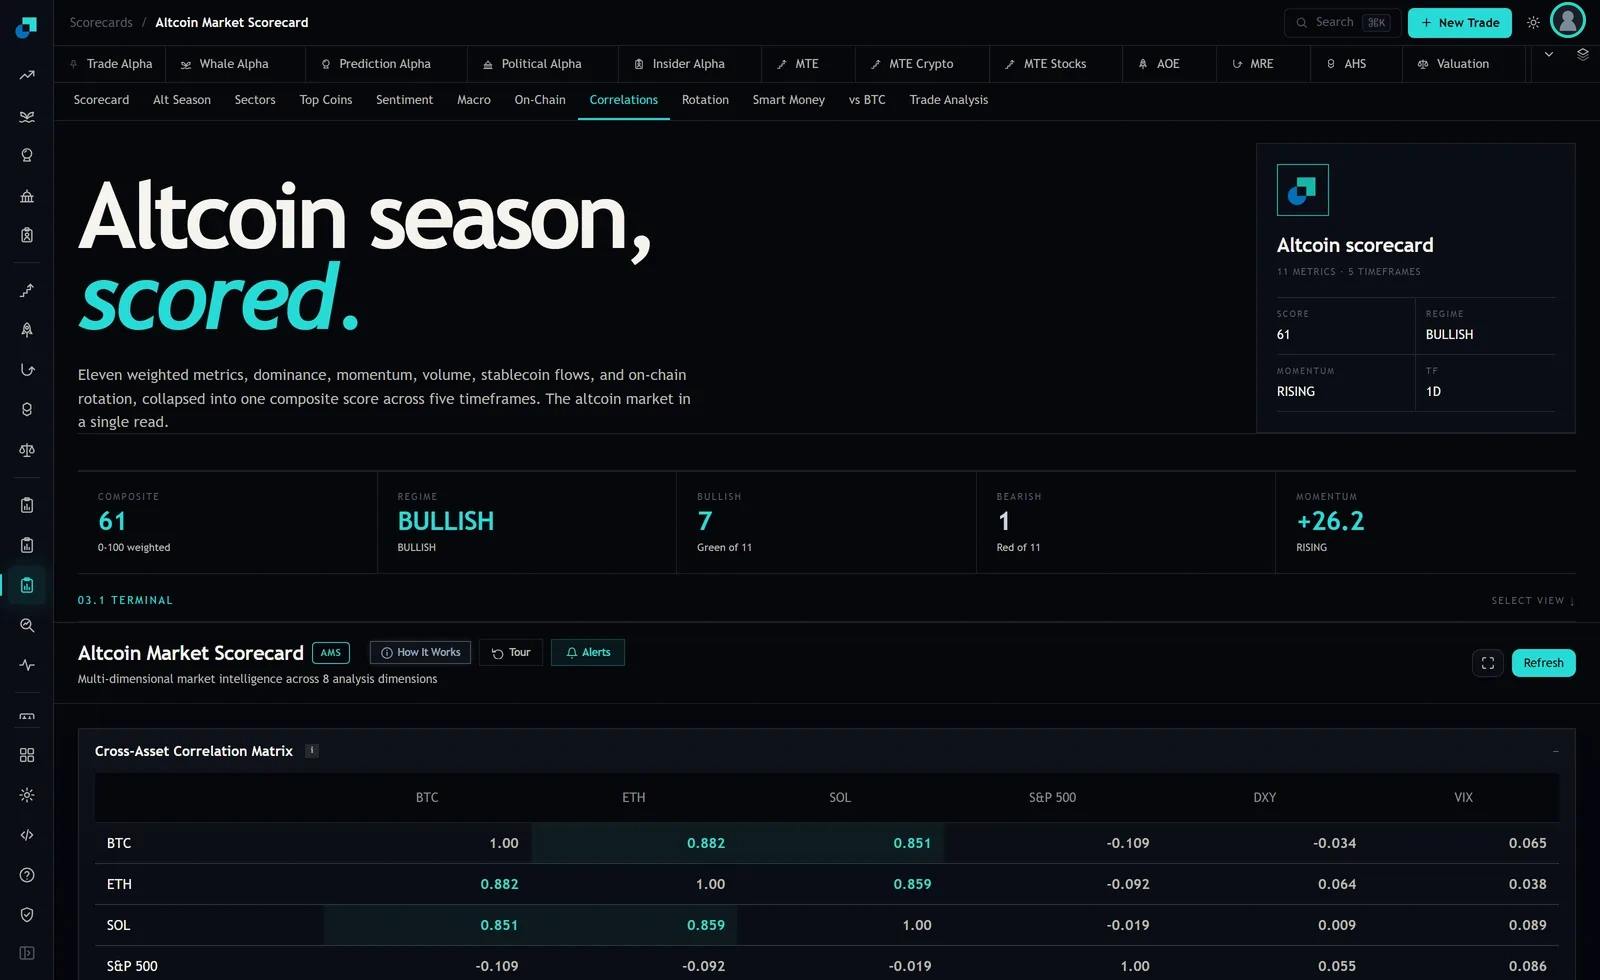
What the panel gives you is a snapshot. One matrix, one estimation window, one moment. It does not show a rolling series, and I cannot confirm any control on it that reports how long a low correlation episode has lasted or how long such episodes typically run. That history is the thing the decoupling question actually needs, so it is work you do rather than a number you read, and the rest of this is how to do it without fooling yourself.
The screen mostly selects the measurement error
Here is the part that people skip, and it is arithmetic rather than opinion.
Any correlation you compute over a finite window is an estimate. The estimate equals the true relationship plus noise, and over a 30 or 60 day window on volatile assets, that noise is not small. Now run a screen over forty tokens and pick the one with the lowest correlation to Bitcoin. You have not selected the token with the weakest true relationship. You have selected the token with the lowest sum of true relationship and noise, and because the noise term varies more across names than the true relationships do, the winner is disproportionately whichever name drew the largest negative error.
The consequence is mechanical. Next window, that name draws a fresh error, which is on average zero, so its measured correlation snaps back toward the group. Nothing changed about the token. The number reverted because it was never that low to begin with. This is the same effect that makes the best performing fund of last year underperform this year, and it operates on correlation screens with more force because correlation estimates are noisier than return estimates.
Look at the printed grid with that in mind. SOL at 0.851 is lower than ETH at 0.882. If you ranked on that, SOL wins the decoupling screen. The margin is 0.031, which on a short window over three volatile assets is comfortably inside the range you would get from noise alone. That is not a finding. That is a coin flip with a decimal point.
Measuring persistence yourself
If you want to know how long these episodes last, you have to build it, and a spreadsheet is enough. Daily closes for the token and for Bitcoin, daily returns, a rolling 60 day correlation in one column, dragged down the history. That is four columns.
Then define an episode before you look at the data, which is the step that keeps you honest. Pick a threshold, say correlation below 0.4, and require it to hold for at least a week so single day spikes do not count. Count how many days each qualifying episode lasted from first crossing to the day it went back above. Write the durations in a list.
Two things to look at. The distribution of those durations, which tells you what you are buying when you buy a decoupling. And what the token's return was from the middle of each episode to sixty days later, which tells you whether being in one paid.
I am not going to hand you the answer for your tokens, because I do not have your universe and I am not going to invent a persistence figure to make the article feel more complete. What I will predict, and what you should test rather than take from me, is that your list of durations will be shorter than your intuition and that the median episode will be well underway by the time a screen surfaces it.
The two decouplings that survive contact
Not all of this is noise. There are two situations where a low correlation reading reflects something real, and both are identifiable in advance rather than after a screen.
The first is an idiosyncratic event. A hack, a chain halt, a delisting, a governance blowup, a token unlock cliff. The token separates from the market because something happened to it specifically. This is real decoupling and it is usually bad news, which is a detail the diversification framing quietly omits. The correlation over the window will genuinely be lower and you would not have wanted to own it.
The second is a structurally different demand source. A token whose price is driven mostly by something outside crypto, or by a mechanical flow like a scheduled buyback or a staking lockup, can carry a persistently lower correlation because the mechanism is persistent. The test is whether you can name the mechanism in one sentence before looking at the correlation. If you can, you have a hypothesis the number can support. If you cannot, you have a number in search of a story.
What to actually do with a decoupled name
Three rules that would have saved me money.
Never let a correlation screen originate an idea. Use it only to check an idea that came from somewhere else. Screens are for elimination, and this one is too noisy even for that on its own.
If you buy a name for diversification, size it as though the correlation is the group average rather than its screened value. On the grid above that means sizing a SOL position as though it correlates to BTC at 0.86, not 0.85, and honestly not even that. Size it as though on the worst day it correlates at 0.95, because that is the day the sizing is for.
And set the review before you buy. Write down the correlation you observed, the date, and the level at which you would accept the decoupling has ended. Then look once a month. The failure mode is not being wrong about the token, it is holding a diversifier for a year after it stopped being one because nobody re-checked the number that justified it.