A volatility surface built on a deep listed chain is mostly measurement. A volatility surface built on a thin crypto chain is mostly assumption wearing the clothes of measurement, and the danger is that both come out of the pipeline looking identical: a smooth sheet, colour-coded, with a number at every node. The consumer downstream cannot tell which nodes were observed and which were manufactured, and by the time that distinction matters it is usually because a risk number was wrong.
The discipline that fixes this is not a better interpolator. It is being explicit, at every stage, about how many independent observations you actually have, and refusing to let the output carry more precision than the input supports.
Count the usable nodes before you fit anything
Start with the grid the chain offers rather than the grid you want. Reading BTC on the Blockcircle Options Desk at 8:08 on 25 August 2026, spot was 79,015.28, at-the-money implied volatility on the front expiry was 38.5 percent against the 79,000 strike, and total open interest on that expiry was 3,952 contracts across 29 strikes. The expiry ladder ran 0, 1, 2, 3, 10, 17, 31, 66, 122, 213 and 304 days.
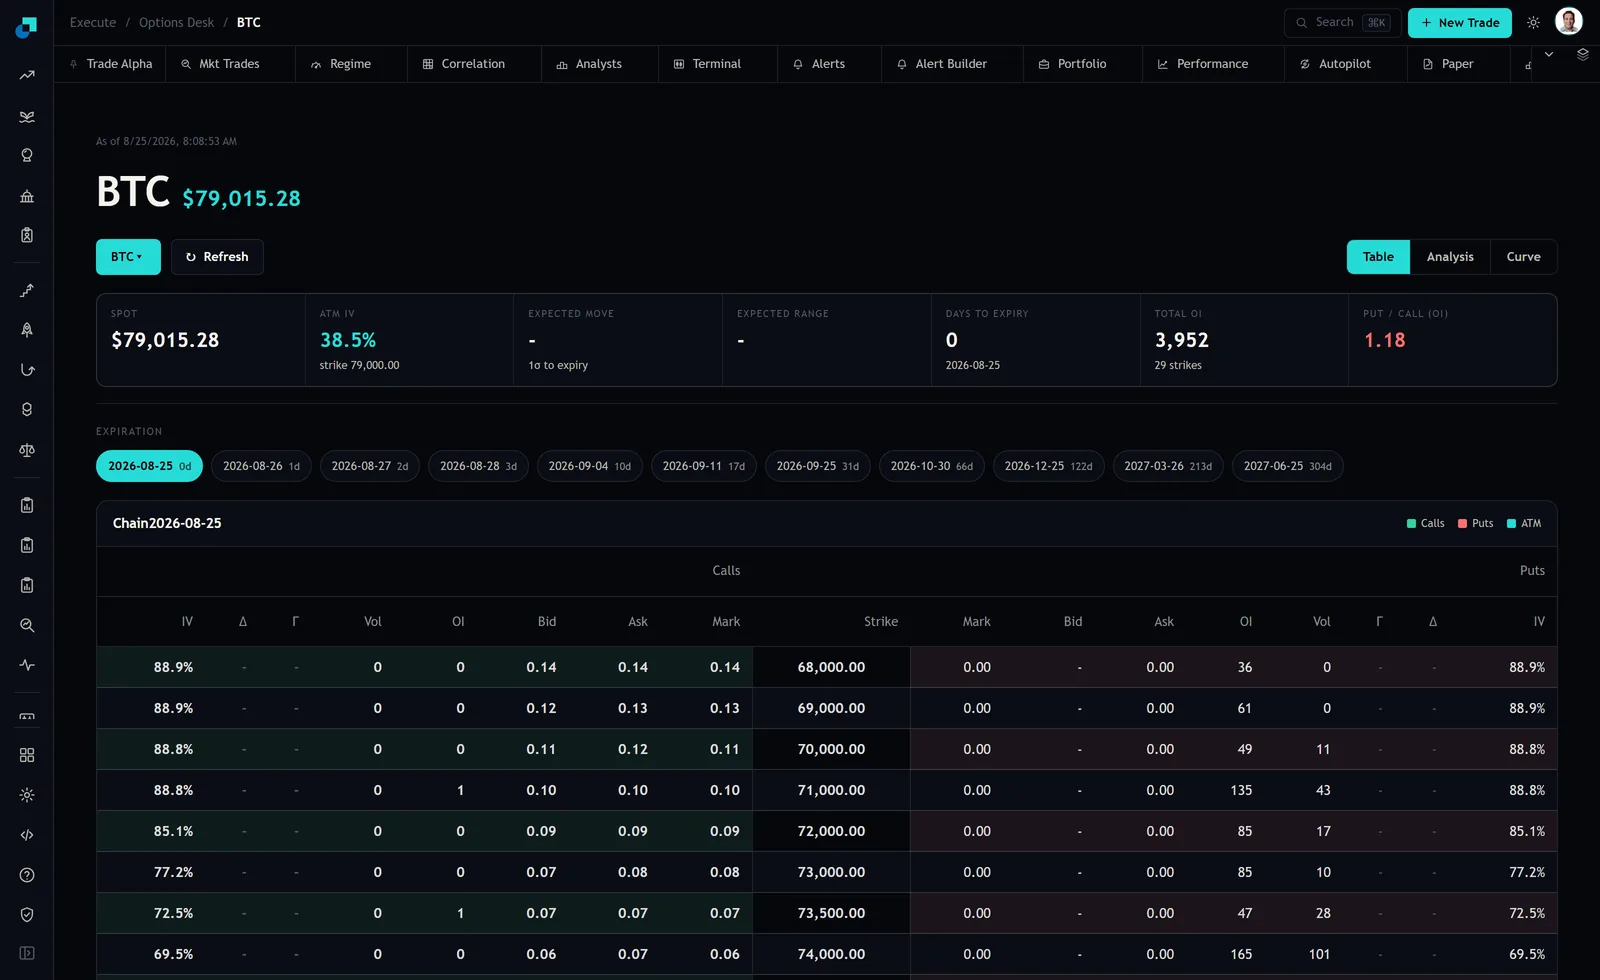
Eleven expiries and up to 29 strikes suggests a grid of a few hundred cells. The number of cells carrying a genuine two-sided market is far smaller. My admission rule for a node has three parts, and a point that fails any of them is excluded from the fit rather than downweighted, because downweighting a bad point still lets it pull the curve.
- A two-sided quote exists, and the spread as a fraction of mid is inside a threshold you set in advance rather than one you relax when the fit looks sparse.
- Open interest at that strike is non-zero, which distinguishes a strike someone has traded from a strike the venue merely lists.
- The implied vol backed out of the mid is finite and the option is not so deep in the money that the vega is negligible, because a near-zero vega point produces an implied number with enormous error bars and no information.
Run that filter on a chain like this one and you commonly end up with a handful of usable points per expiry, clustered near the money, and two or three expiries where nothing survives. That is the honest input, and it should be recorded alongside the surface as a node count per expiry.
Fit in total variance against log-moneyness, not vol against strike
The coordinate choice is not cosmetic. Working in total implied variance, meaning volatility squared multiplied by time to expiry, plotted against the log of strike over forward, converts the two no-arbitrage conditions you care about into simple shape checks.
Calendar arbitrage becomes a monotonicity condition: at a fixed log-moneyness, total variance must not decrease as maturity increases. If your fitted 66-day node sits below your fitted 31-day node at the same moneyness, you have built a surface that offers free money, and any pricer that consumes it will find that money and put it in a position. Butterfly arbitrage becomes a convexity condition across the strike axis at fixed maturity. Both are checkable in a loop over the fitted grid, and both should be a hard gate on publication rather than a warning in a log file.
There is also a practical benefit on a chain this sparse. Total variance is roughly linear in time under a wide range of reasonable assumptions, which means interpolating along the maturity axis in variance space is a defensible default. Interpolating volatility linearly in time, which is what a naive implementation does, systematically misprices the short end.
Bridging the gaps, and the error each method introduces
Every method of filling a hole has a characteristic way of being wrong, and you should be able to name it for the one you chose.
A cubic spline through the strike axis is the most common choice and it overshoots in the wings, where it has the fewest anchors. Overshoot in variance space produces an implied risk-neutral density that goes negative, which is not a rounding problem, it is a statement that your surface prices a set of outcomes at less than nothing. Constrain the extrapolation beyond the last observed strike to something flat or linear in log-moneyness and accept that you are asserting the wing rather than measuring it.
A parametric form fitted per expiry is the cleaner discipline, mostly because it forces an honest ratio. A five-parameter slice fitted to six admitted points is not a fit, it is a restatement of the points with extra degrees of freedom, and it will move violently when one quote updates. Where a slice has fewer usable points than the parameter count plus a margin, borrow shape from the nearest well-populated expiry and fit only the level. Record that you did so.
The maturity axis has a specific trap on this ladder. The gap from the 31-day to the 66-day expiry is 35 calendar days wide, and the next two gaps are wider still. Any node you interpolate inside those gaps is a smooth guess about a stretch of calendar that may contain a scheduled event. The forward variance you back out between two widely separated expiries is an average over that whole window and should never be presented as the price of volatility on a particular date.
One more, particular to this screen: the front expiry that morning had zero days to expiry, and the expected move and expected range tiles rendered as a dash rather than a number. A pipeline that reads those fields mechanically receives a null at the very front of the curve. Handle it explicitly. A zero substituted for a null at the short end will drag the entire front of your variance curve toward the floor and can invert the calendar condition all by itself.
Where a thin surface lies first
The failures arrive in a predictable order, and knowing the order tells you which downstream consumers to warn.
The wings go first, which means every tail measure goes with them. A stress number computed from a surface whose wings were extrapolated rather than observed is reporting your extrapolation convention back to you with a confidence interval it has not earned. Second is forward volatility between sparse expiries, for the reason above. Third is any greek computed by finite differences across a coarse strike grid, because the bump size that gives a stable derivative on a dense chain gives a noisy one here. Fourth, and most damaging to a desk's credibility, is the mark on positions you already hold: if the strike you own is one of the manufactured nodes, your daily P&L is partly an artifact of your own interpolation, and attribution becomes impossible to defend.
Publishing a surface you do not fully trust
None of this argues against building the surface. It argues for shipping it with its provenance attached, which costs almost nothing and changes how it gets used.
Every node should carry a flag saying whether it was observed, interpolated between observed points, or extrapolated beyond them. Every slice should carry its admitted node count. The whole surface should carry the venue timestamp, which on this desk is shown as an explicit as-of time on the page, along with the age of the oldest quote that entered the fit, because a surface assembled from quotes of wildly different vintage is a composite of several different markets. Marks taken from extrapolated nodes should require a second signature.
The tradeoff is real and worth stating: a surface tagged this way will visibly fail to support some of the reports people want to run, and someone will ask you to remove the flags so the dashboard is green. That request is the entire reason to build it this way. A thin chain does not become deep because the output is smooth, and the cost of pretending otherwise is paid in a single position, on a single day, at the wing you never actually observed.