Nothing in a strategy library announces that its parameters were chosen on the same data the results are drawn from. The published row looks identical either way: a return, a win rate, a Sharpe, a drawdown. The difference is in the relationships between those fields, and in one structural question about the drawdown that a fitted curve almost never answers well.
This is a screening exercise, not a proof. The point is to decide, in under a minute per row, which strategies are worth the diligence call and which are not.
What the strategies table publishes, and what it withholds
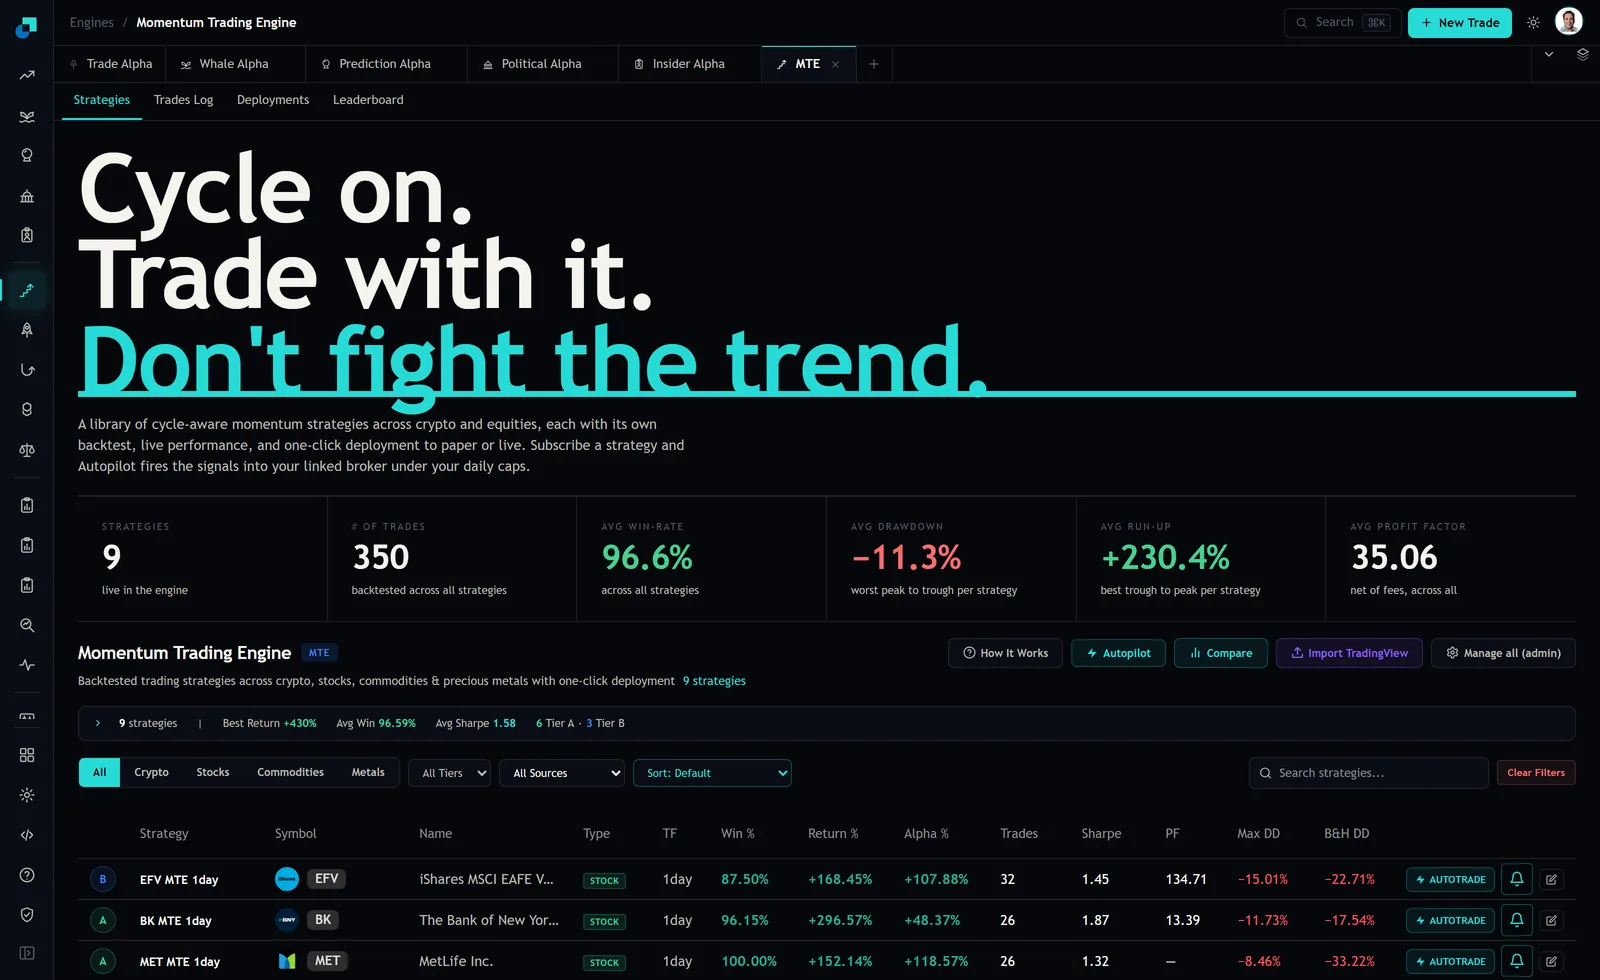
The engine's strategies tab lists each configuration as a row with columns for Strategy, Symbol, Name, Type, TF, Win percent, Return percent, Alpha percent, Trades, Sharpe, PF, Max DD and B and H DD, alongside tier badges and an autotrade action. Above the table a summary bar read 9 strategies, best return plus 430 percent, average win 96.59 percent, average Sharpe 1.58, with 6 Tier A and 3 Tier B. Filters cover asset class, tier and source, with a default sort.
Now the withholdings, and I want to be precise rather than insinuating about them. No column on that row states whether the parameters were estimated on the displayed period or on an earlier one. No column gives the number of free parameters. No column gives the start date of an out of sample segment, and the row does not carry an equity curve. So the classic first tell, curve smoothness, is not available to you here at the screening stage. You will get it in the diligence pack or you will not get it at all, and if the provider cannot produce a dated equity series the conversation is over anyway.
What you do get is enough. Win percent, Trades, Sharpe, PF, Max DD and B and H DD sitting on the same line support three ratio tests that a fitted result struggles to pass.
Tell one, a win rate that is too clean for the sample behind it
The MET MTE 1day row reads a 100.00 percent win rate across 26 trades. Take that literally for a moment and ask what true win rate is consistent with 26 wins and no losses. A process with a genuine 90 percent hit rate produces 26 consecutive wins about 6 percent of the time. At 95 percent it is roughly 26 percent of the time. So the observed record is not impossible for a very high quality process, and it is also exactly what you would see if the exit rule had been tuned until the losing trades stopped appearing.
The screening question is therefore not whether the number is fake. It is whether the number is informative, and a perfect record is the least informative outcome you can be shown, because it truncates the loss distribution you actually need to size against. You cannot compute an average loss from a set with no losses. You cannot compute a loss tail. Every risk figure downstream of that row is an extrapolation.
The same reasoning applies to the library aggregate. An average win rate of 96.59 percent across nine strategies means the loss side of this entire library is a handful of observations. That is a statement about sample construction, not about skill, and it is the first thing I would raise on the call.
Tell two, profit factor against trade count and parameter count
Profit factor is gross profit divided by gross loss, so it inherits the same problem in an amplified form. The EFV MTE 1day row shows a profit factor of 134.71 on 32 trades with an 87.50 percent win rate. Four losing trades, then, and a ratio dominated by how small those four happened to be. One additional loss of ordinary size would move that figure by an order of magnitude. A metric that a single future observation can reprice by 90 percent is not a ranking key, it is a sample artefact.
Which brings up the ratio that matters most and that the table cannot give you: free parameters against trades. Ask for the count of tunable inputs in the configuration, including the ones people forget, the lookback, the smoothing, the entry threshold, the exit threshold, the stop multiple, the filter, the instrument choice itself. Then divide the trade count by it. With 26 to 32 trades on these rows, a configuration with five tunable inputs is fitting roughly six observations per parameter. State your own bar in advance and hold it, because arguing about it after you have seen a good-looking curve is a lost argument. Thirty trades per free parameter is a defensible floor and almost nothing in a library of this sample length will clear it.
Note that the row does not need to be dishonest for this to be true. The provider labels this as backtested performance. The failure mode is the reader treating an in sample fit as a forward expectation.
Tell three, where the first serious drawdown sits
This is the structural tell and it is the one worth spending the diligence call on. Request the drawdown series with dates, then ask a single question: when did the worst drawdown occur relative to the parameter estimation window?
Two patterns are informative. If the largest drawdowns cluster in the earliest part of the record and the curve becomes progressively smoother towards the present, you are usually looking at parameters chosen on the later data, which is the fitted signature. If the record has genuine out of sample segments, the out of sample portion will contain at least one drawdown comparable in size to the in sample maximum, because that is what out of sample means. A record whose second half is materially calmer than its first half is making a claim about the world that needs a mechanism behind it.
The table gives you the anchor for that conversation. Each row shows Max DD next to the buy and hold drawdown for the same instrument. EFV MTE 1day reads a maximum drawdown of minus 15.01 percent against a buy and hold drawdown of minus 22.71 percent. MET MTE 1day reads minus 8.46 percent against minus 33.22 percent. The second gap is large, and a strategy that took a quarter of the instrument's own drawdown while capturing a triple digit return is either a real regime filter or a set of exit rules fitted to the specific declines in this sample. The dated series tells you which, and nothing on the row does.
The four questions that settle it on the call
Screening gets you to a shortlist. These four questions get you to a decision, and they should be sent in writing so the answers are on the record.
First, what data was held out, and on what date was it carved out? The date matters more than the size. A hold out defined after the researcher had already seen the full series is not a hold out.
Second, how many configurations were evaluated in total to arrive at this one? Not how many are published, how many were tried. The library shows 9 strategies and a naming convention with numbered configurations, so the search space behind the published set is a number the provider knows and you do not.
Third, was the parameter set re-estimated at each step of the walk forward, or estimated once and then applied forward? Only the first is walk forward. The second is a single in sample fit with a delayed start, and it is described as walk forward more often than not.
Fourth, do the published figures include costs, and at what assumption? The engine's own profit factor tile is labelled net of fees across all, which is a start, but fees are not slippage and a daily strategy on an equity gets filled at the open rather than at the candle boundary the backtest used. Ask for the gross and net pair. If only one number exists, you have learned something about how carefully the rest of it was constructed.