Two columns on the Whale Finder sit four cells apart and have to be read together or not at all. Win% tells you the share of a wallet's trades that came out ahead. Trd tells you how many trades that share was computed from. A big number in the first column with a small number in the fourth is the most reliable way to talk yourself into copying a stranger.
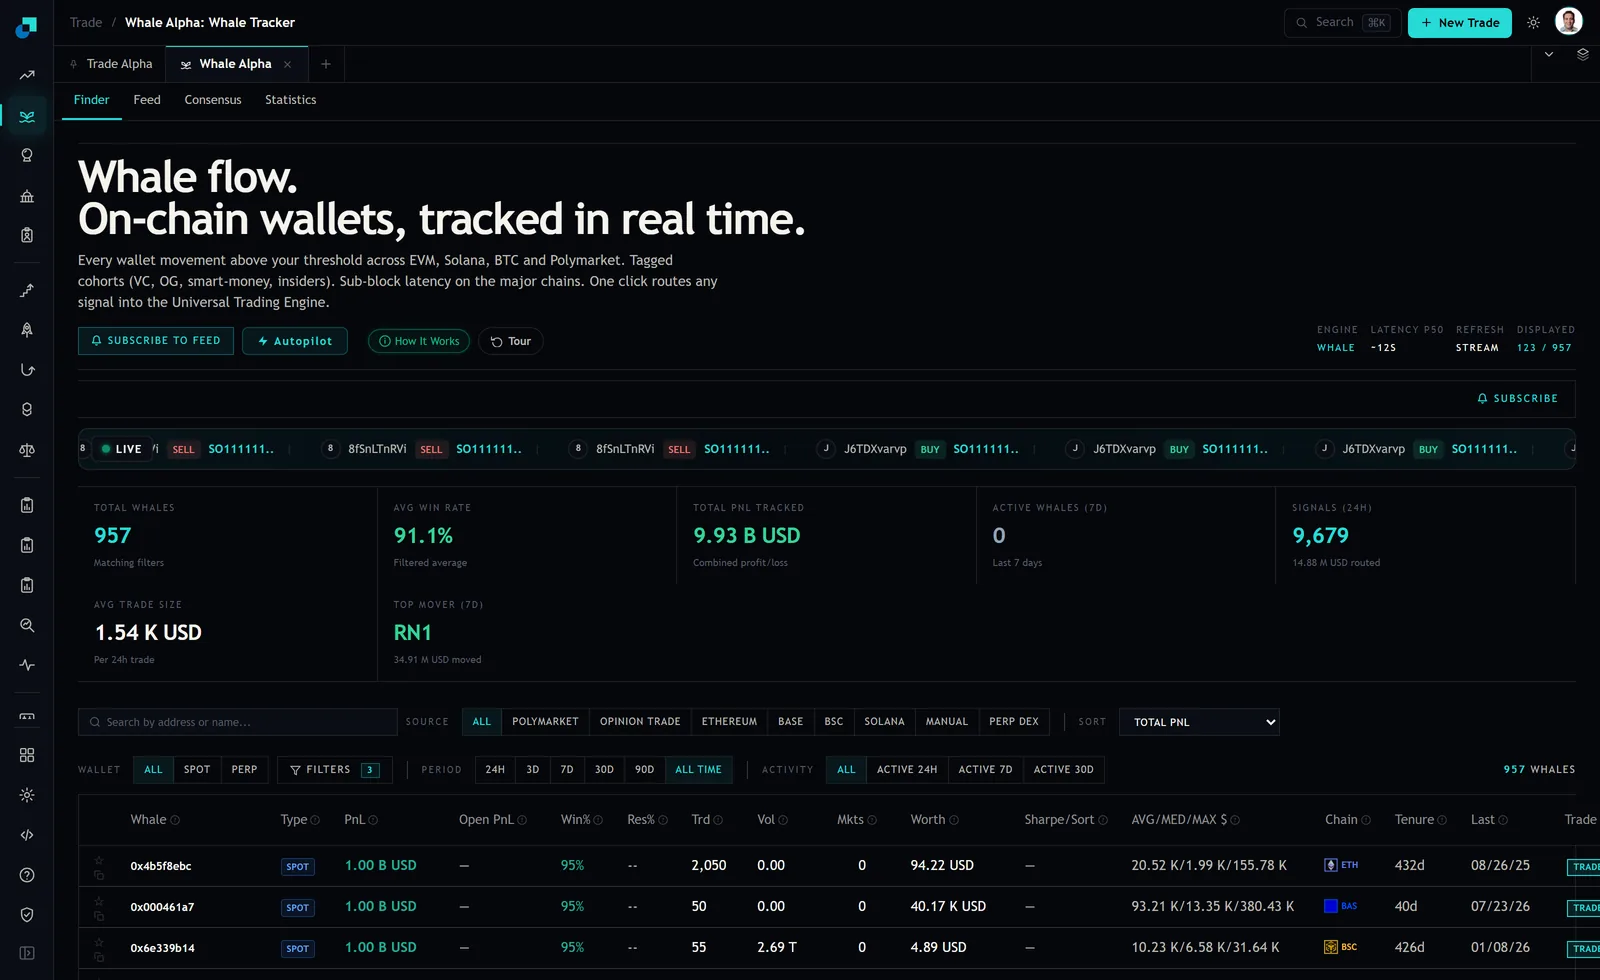
At capture the second row of the table showed 95 percent against 50 trades, on a wallet with 40 days of tenure trading on Base. Most people read that and stop. The interesting part is what happens when you actually run the test everyone assumes they are running.
The coin-flip test, run properly, says the wallet is fine
The standard question is whether a track record could plausibly have come from a wallet with no edge at all, a coin flip. For a win rate of p over n trades, the distance from a coin flip in standard errors is roughly the excess over 50 percent, multiplied by the square root of n, divided by a half. Put 60 percent into that and you need about 96 trades before the record separates from chance at the usual threshold. Put 55 percent in and you need about 384.
Now put 95 percent in. The record separates from a coin flip after about five trades. Fifty trades at 95 percent is not marginal, it is not borderline, it is so far from a coin flip that the arithmetic stops being interesting. So if the coin-flip test is the check you were relying on, this wallet passed it before you finished reading the row.
That is the trap, and it is the opposite of the one people warn you about. The problem with 95 percent over 50 trades is not that the sample is too small for the number. It is that the number is too good for the sample to be describing what you think it describes.
The three rows that ruin the reading
Look at the whole table instead of one row. At capture the top three rows all showed a win rate of 95 percent, and all three showed total PnL of exactly 1.00 B USD, across wallets on three different chains with 2,050, 50 and 55 trades and tenures of 432, 40 and 426 days. Their Worth column read 94.22 USD, 40.17 K USD and 4.89 USD.
Three unrelated wallets producing byte-identical headline statistics is not a coincidence you should explain away. It is the signature of a capped, defaulted or truncated field. Supporting that reading, the Res% column showed a double dash on all three rows and the Sharpe column showed a dash, so the platform is telling you the resolution basis and the risk-adjusted figure were not available for these wallets. A win rate you cannot decompose into resolved and unresolved trades is a number without a denominator you can inspect.
The same module gives you the sanity check on the Statistics tab, where the average win rate across 26,687 tracked whales read 44.3 percent, and on the Feed, where the average whale win rate tile read 12.1 percent. A population that averages 44.3 percent does not have its top three rows all landing on precisely 95 percent. When a filtered view disagrees this violently with the population it was filtered from, the filter is the thing to interrogate.
Win rate says nothing about the size of the wins
Even where the number is real, win rate is silent on the only thing that determines whether copying pays. It counts trades, not dollars. A wallet can win nineteen times out of twenty and still be underwater if the twentieth loss is bigger than the nineteen wins combined.
The Feed tab makes this concrete. On the same day, one tracked position showed a PnL of minus 99.9 percent, and another showed plus 202.1 percent. Those two rows belong to different wallets and different markets, but they tell you the size of the tail this module is looking at. A single row of that magnitude reorders a wallet's dollar outcome without moving its win rate by more than a couple of points.
So the column that actually matters sits further right. AVG/MED/MAX gives you the average, median and maximum trade size. On that 50-trade row it read 93.21 K, 13.35 K and 380.43 K. The maximum is 28 times the median, which tells you the wallet's outcome is dominated by a handful of oversized clips, and a 95 percent win rate computed over trades gives those clips exactly the same weight as a 13 thousand dollar routine one.
You picked this wallet out of 957
There is one more correction and it is the one people skip. You did not walk up to this wallet at random. It was at the top of a table of 957 wallets matching your filters, sorted by total PnL, out of 26,687 tracked. Sorting a large population by an outcome and then testing the top of the list is a different question from testing a wallet chosen in advance.
The rough adjustment is to demand more evidence in proportion to how many candidates you searched. With 957 candidates, the threshold for a single wallet moves from roughly two standard errors to roughly four. Under that stricter bar, a 60 percent wallet needs about 411 trades rather than 96, and a 55 percent wallet needs about 1,640 rather than 384. Those are the trade counts at which a plausible, human-sized edge stops being explicable by having looked at a thousand wallets.
The filter I set before I open the table
Three rules, all of which you can apply this week without leaving the Finder.
- Set a floor on Trd before you sort. I use 200 for anything I would copy with real money. Below that, the wallet goes on a watch list and nowhere near a position, no matter how the Win% column reads.
- Treat any win rate above roughly 80 percent as a data question rather than a finding. Open the wallet, check whether Res% and Sharpe are populated, and compare Worth against the claimed PnL. On those three capture rows, a claimed billion dollars of PnL sat next to a Worth of 4.89 USD, and the two cannot both be describing the same wallet.
- Read AVG/MED/MAX before you read Win%. If the maximum is more than about ten times the median, the wallet's record is a story about a few trades, and the win rate is describing the trades that did not matter.
The wallet worth copying is the boring one: several hundred trades, a win rate somewhere in the fifties or sixties, a maximum clip within a few multiples of its median, and a Worth figure consistent with the PnL it claims. It will never be the top row of a table sorted by total PnL, which is precisely why the top row keeps costing people money.