The story every altcoin cycle gets told through is a ladder. Money arrives in Bitcoin first, spills into the large caps, then into the mid caps, and finally into the small caps where the returns are largest and the exits are worst. It is a useful mental model. It is repeated so often that people skip the part where you check which rung the market is standing on, and buy the rung they wish it was on instead.
The check takes a couple of minutes, but it requires being honest about what the screen in front of you actually contains. I use the Rotation tab of the Altcoin Market Scorecard, and the first useful thing to say about it is what is not there.
What the rotation tab actually prints
There is no cap-tier strip on this tab. No row of majors, mid caps and small caps with a return printed under each one. What you get instead is a three-state rotation signal, three gauge cards underneath it, and a fourteen-row sector ranking further down the page.
The signal is a vertical toggle with three positions: ALT at the top, HOLD in the middle, BTC at the bottom. On this capture the marker sits on HOLD, the headline reads Hold Current Allocation, and the line under it says mixed signals across indicators, maintain current positions and wait for confirmation. The Rotation Score reads 43.4 out of 100.
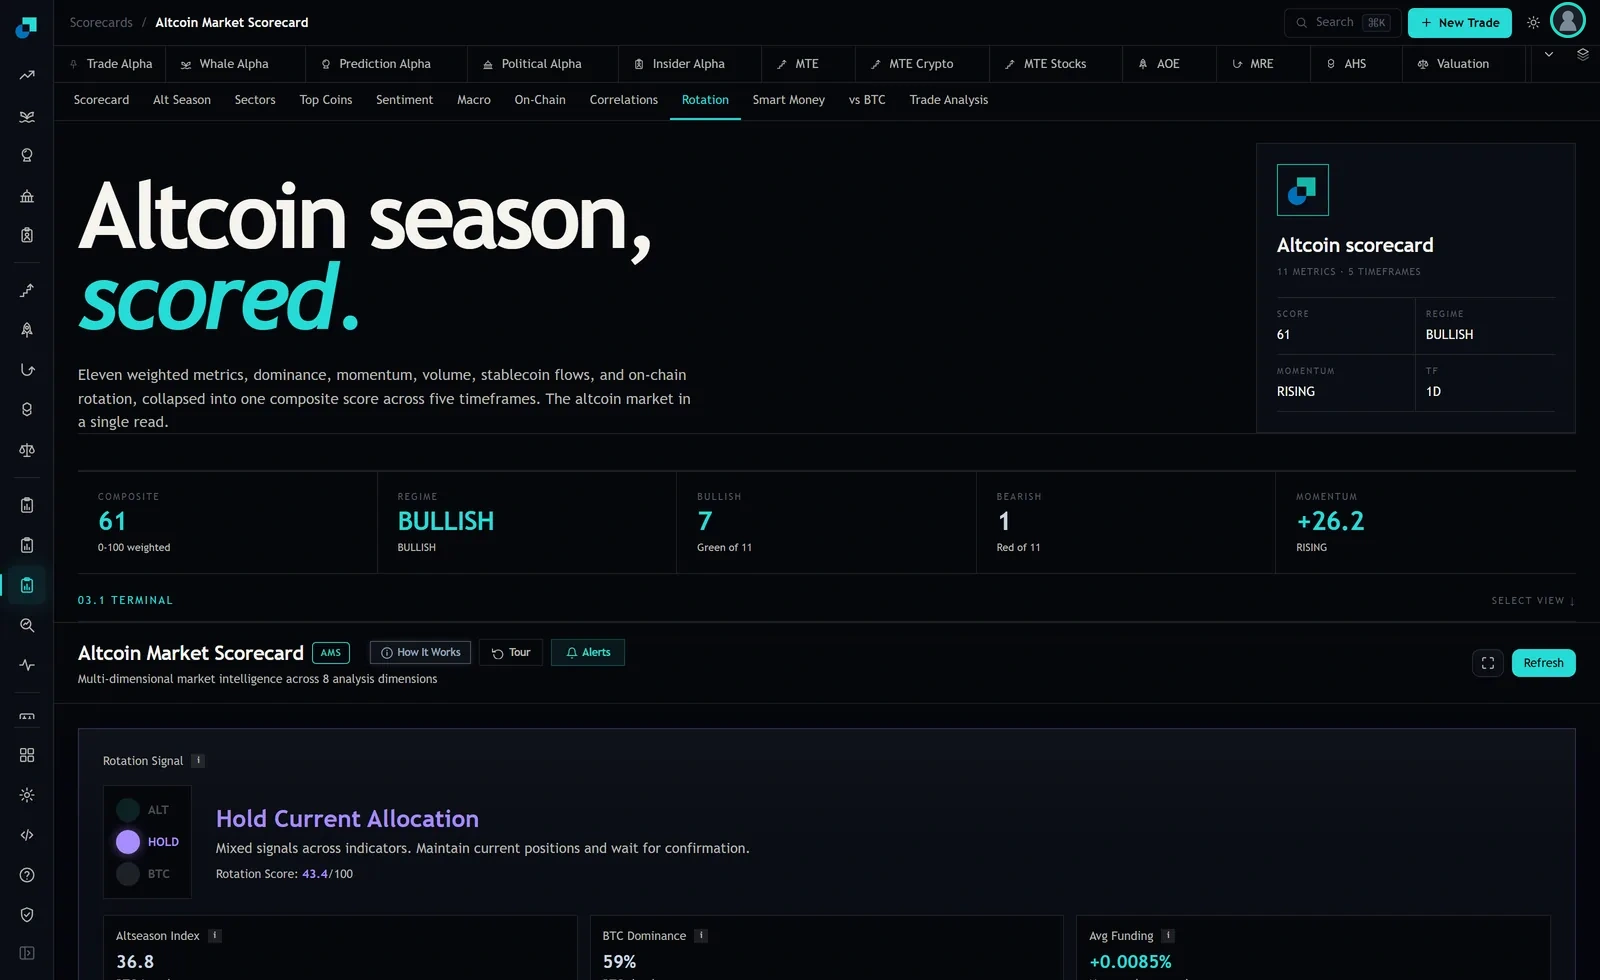
The three cards below the signal are the ones I actually use to name a rung. Altseason Index reads 36.8 and is labelled BTC-Leaning. BTC Dominance reads 59 percent and is labelled BTC-dominant. Avg Funding reads +0.0085 percent and is labelled Not overleveraged.
Naming your rung from three numbers
Take them in order, because they map onto the ladder in order.
BTC Dominance at 59 percent is the first rung talking. Dominance is Bitcoin's share of total crypto market capitalisation, and while it is high and holding, the money that has arrived is still sitting where it landed. It has not been passed along. Fifty-nine percent describes a market where Bitcoin holds a clear majority of the value on the board.
The Altseason Index at 36.8 is the second and third rungs talking. The module defines this index on its Alt Season tab as the percentage of the top 50 altcoins outperforming Bitcoin, and on that tab the underlying counts at capture were 19 of 50 over seven days and 18 of 50 over thirty days. Fewer than two in five of the largest alts are beating Bitcoin. Broad large-cap outperformance, which is what rung two looks like when it is real, is not happening yet.
Avg Funding at +0.0085 percent is the crowding check. Perpetual funding is what longs pay shorts to keep a position open, and it goes up when leveraged demand piles into one side. A reading this close to zero, which the card labels Not overleveraged, tells you the crowd has not arrived. That is usually a good thing for someone thinking about entering and a bad thing for someone waiting for confirmation that the ladder is in motion.
Put the three together and this reading names rung one, possibly the earliest part of rung two. It does not name small caps. Anyone buying micro caps on this screen is not riding a rotation, they are guessing at one two rungs ahead of the evidence.
The market cap column is the only tier information here
The sector ranking further down the tab has five columns: rank, sector, 7d average, 30d average, market cap, and momentum. The market cap column is the closest thing on this tab to a cap-tier read, and it is worth walking down it.
The biggest bucket on the board is Layer 1 at $2.2T, and it sits fifth with +28.2 percent over seven days. Meme Coins ranks first at +40.7 percent on a $25.7B bucket, Layer 2 second at +37.2 percent on $7.5B, DEX Tokens third at +34.0 percent on $27.3B. Down at the other end, Storage at $1.4B ranks twelfth with +16.9 percent, Gaming and GameFi at $1.4B ranks thirteenth with +15.4 percent, and NFTs at $2.7B ranks eighth with +21.7 percent.
Read that shape carefully. The smallest buckets on the screen are clustered at the bottom of the ranking, and the largest bucket is mid-table. If capital had already worked its way down to the last rung, the small buckets would be at the top. They are not.
Two honest caveats. Sector market cap is not coin market cap, so this is a proxy and not a tier read. A $1.4B sector can contain one $900M token and a long tail of dust, and the Layer 1 bucket at $2.2T contains Bitcoin itself. And the momentum column reads RISING on all fourteen rows, which means that column separates nothing this week. A column where every row says the same word carries no information about which sector to prefer, and you should stop looking at it the moment you notice that.
What HOLD at 43.4 is telling you not to do
HOLD is the least satisfying of the three states and it is the one that costs people the most, because it is the one they trade through. The rotation score of 43.4 out of 100 sits below the midpoint. The tab is not telling you the market is falling. It is telling you the evidence for moving down the ladder has not accumulated.
There is a disagreement on the platform worth noticing here, because it is exactly the kind of thing that gets averaged into mush if you only read one panel. The Scorecard tab summary at capture said conditions favour altcoin exposure and suggested rotating from Bitcoin into higher-beta altcoins, with the composite at 61 and the regime BULLISH. The Rotation tab, on the same data, says HOLD at 43.4. Both are on your screen at the same time.
That is not a bug to resolve, it is information. A bullish altcoin composite says the environment is supportive. A rotation signal at HOLD says the sequencing evidence is thin. The reasonable action is to hold the exposure you have rather than to add the highest-beta thing on the board, and to write down what would change your mind: dominance rolling over from 59 percent, the Altseason Index crossing above 50, and the toggle moving from HOLD to ALT. Two of those three, and I am adding. None of them, and the ladder story is just a story.
Where the ladder breaks and what you can control
The ladder is a description of what past cycles looked like afterwards. It is not a mechanism, and nothing enforces the order. Rungs get skipped. A single narrative can pull one small-cap sector to the top of the ranking while the rest of the tier does nothing, and that is not a rotation, that is one trade with a lot of noise around it. Sequences that took months in one cycle have compressed into a fortnight in another.
So the practical value of naming your rung is not that it predicts the next one. It is that it stops you paying rung-four prices for rung-one evidence. That is the entire trade this screen supports, and it is worth more than the forecast people want from it.
What you actually control is size. If you decide the ladder is worth playing before the gates confirm, the honest way to do it is with a position small enough that being two rungs early is a survivable outcome rather than the whole year. Being early on the ladder and being wrong about it look identical for a long time, and only one of them pays.