Most people read a correlation matrix one cell at a time. They find the row for the coin they own, run along it, note that the number against Bitcoin is high, feel briefly bad about it, and close the tab. That is reading a grid. It is not reading a matrix, and it throws away the only thing a matrix can tell you that a list of pairs cannot.
A correlation matrix is a picture of blocks. Assets that move together form a square of high numbers, and the boundary of that square is a real object. It tells you how many distinct bets you own, which is almost never the number of tickers in your account. Six positions inside one block is one bet held six times, at six times the fee load, with six times the research burden and none of the diversification you thought you were buying.
What is on the correlations tab
The Correlations tab of the altcoin scorecard shows a panel called Cross-Asset Correlation Matrix. On this capture the assets across the top are BTC, ETH, SOL, S&P 500, DXY and VIX, with the same names down the side, and every cell is a printed number rather than a colour block.
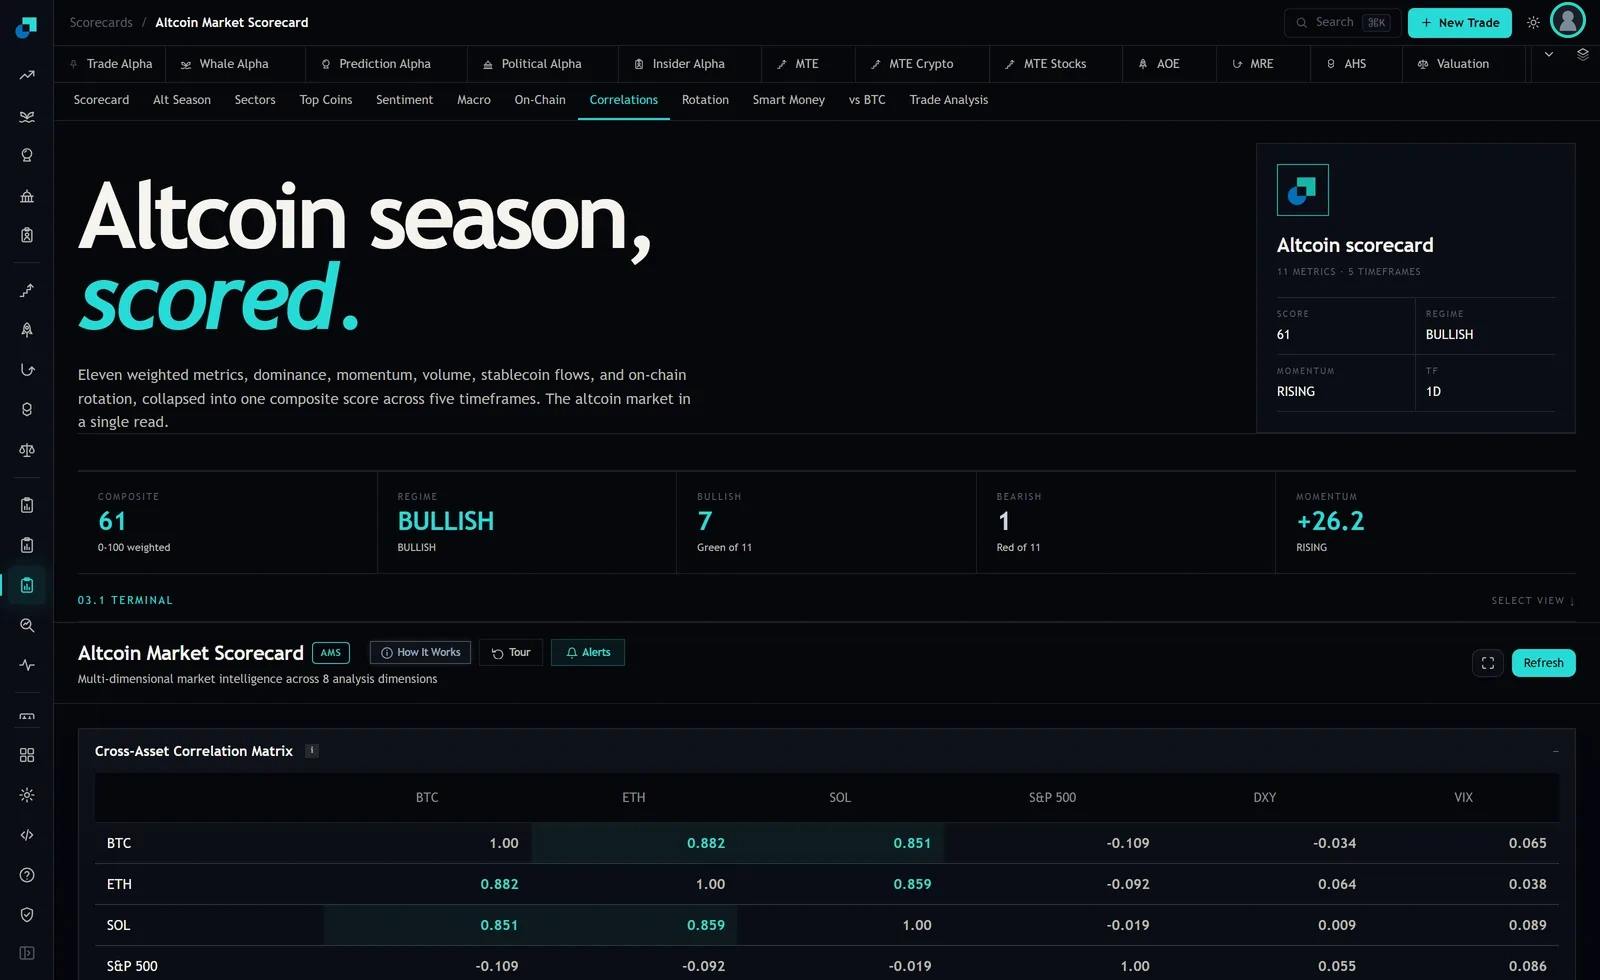
The values in the crypto square are BTC to ETH at 0.882, BTC to SOL at 0.851, and ETH to SOL at 0.859. The cells joining those three to the macro assets are BTC to S&P 500 at minus 0.109, ETH at minus 0.092, SOL at minus 0.019, then against DXY minus 0.034, 0.064 and 0.009, and against VIX 0.065, 0.038 and 0.089.
I should say plainly what this panel is and is not, because the phrase cluster map implies a control I cannot confirm exists here. What you get is a numeric grid in a fixed order. There is no visible button that reorders the rows for you, and the tab covers a short list of large assets rather than a wide altcoin universe. The good news is that the reordering is the easy part, and at this size you can do it by eye.
Doing the clustering by hand
Clustering algorithms are sophisticated. What they produce, for a grid this small, is something you can reproduce in five minutes with a pen.
Pick any asset and write it down. Run its row and find the asset it correlates with most strongly, then write that one next to it. Run the new asset's row, find its strongest partner among the names not yet placed, and continue. When the next strongest available number drops sharply, stop. You have just found a block boundary. Start a new group with whatever is left and repeat.
On the grid above that procedure terminates almost immediately. Start at BTC, its strongest partner is ETH at 0.882, ETH's strongest remaining partner is SOL at 0.859, and then the next available number falls off a cliff to 0.089 against VIX. Three names, one block, boundary found. The macro assets form a loose second group with values so low that calling it a block is generous.
That fall from 0.859 to 0.089 is the whole point of the exercise. It is not a gradient. It is a wall. Inside the wall, the three assets are close to the same instrument at different volatilities. Outside it, the relationship is weak enough that it should not drive your allocation either way.
The boundary names your real bet
Once you can see the block, count your positions inside it. If you hold BTC, ETH and SOL, this grid says you own one bet at three tickers. Not zero diversification, since 0.86 is not 1.0, but far closer to one position than to three. The practical consequence is that your worst day is roughly your whole book moving together, and any plan that assumes one holding will hold up while another falls is not supported by anything on this screen.
This reframes the usual question. People ask which coin to add. The better question is which block a candidate joins. A fourth large-cap L1 almost certainly joins the block you already own, which means it adds research and fees and changes your risk by very little. A position that would sit outside the block is doing something different, and the number to check before buying is not its return history but its correlation to the block you already have.
Be careful about the flip side. The crypto to macro numbers here are small, and a small correlation is not a hedge. Minus 0.109 between BTC and the S&P 500 means close to no relationship on this window, not an offsetting one. Reading a near-zero number as protection is the most common mistake made with a grid like this.
What a block coming apart looks like
Blocks are not permanent, and the moment one starts to break is genuinely useful because it is when selection between names starts to pay again.
The failure mode is watching the average and missing the split. A block does not usually dissolve evenly. One name leaves first. So the thing to track is not the mean of the square but its spread. If BTC to ETH stays at 0.88 while BTC to SOL slides toward 0.6, the block has not weakened, it has split into a pair and a single, and that single is now a separate bet that deserves separate sizing.
Practically, take a reading on a fixed schedule and keep it. Once a month, write the crypto square into a file with the date. Three numbers, thirty seconds. What you are looking for over a few months is one cell moving away from the others, and you will only see it if you have the history, because a single snapshot cannot show you a trend no matter how carefully you stare at it.
Expect the change to be temporary more often than not. Blocks in crypto have a habit of reforming under stress, and a name that decoupled in a calm month tends to rejoin the square on the day it would have been useful for it not to.
The cell that tells you to check the window
One number on this grid should stop you, and it is not in the crypto square. S&P 500 against VIX reads 0.086.
Over most historical windows that pair is strongly negative, because the volatility index tends to rise when equities fall. A reading near zero is not impossible, but it is unusual enough that it tells you something about the measurement rather than about the market. The matrix does not state its lookback window or its data frequency on the panel, and those two choices change every number on the screen.
So use that cell as your sanity check. Before leaning on any correlation here, find out what window it covers, either from the module's How It Works control or by asking. A correlation without a window is not a fact about two assets, it is a fact about a particular stretch of time, and the same pair over sixty days and over two years will regularly hand you different answers and different block boundaries.