If you have ever run a currency through a general purpose relative strength screen and watched it come back with a score in the teens, the natural conclusion is that the currency is weak. Usually it is not. It is a low volatility asset being measured on a scale that was calibrated by high volatility ones, and on that scale it could not have scored well no matter what it did.
This matters more on the Asset Outperformer Engine than on most screens, because the benchmark basket it scores against is unusually energetic. All assets are compared to Bitcoin, Ethereum, Solana, gold and the S&P 500, and three of those five are crypto.
What the top of this board looks like
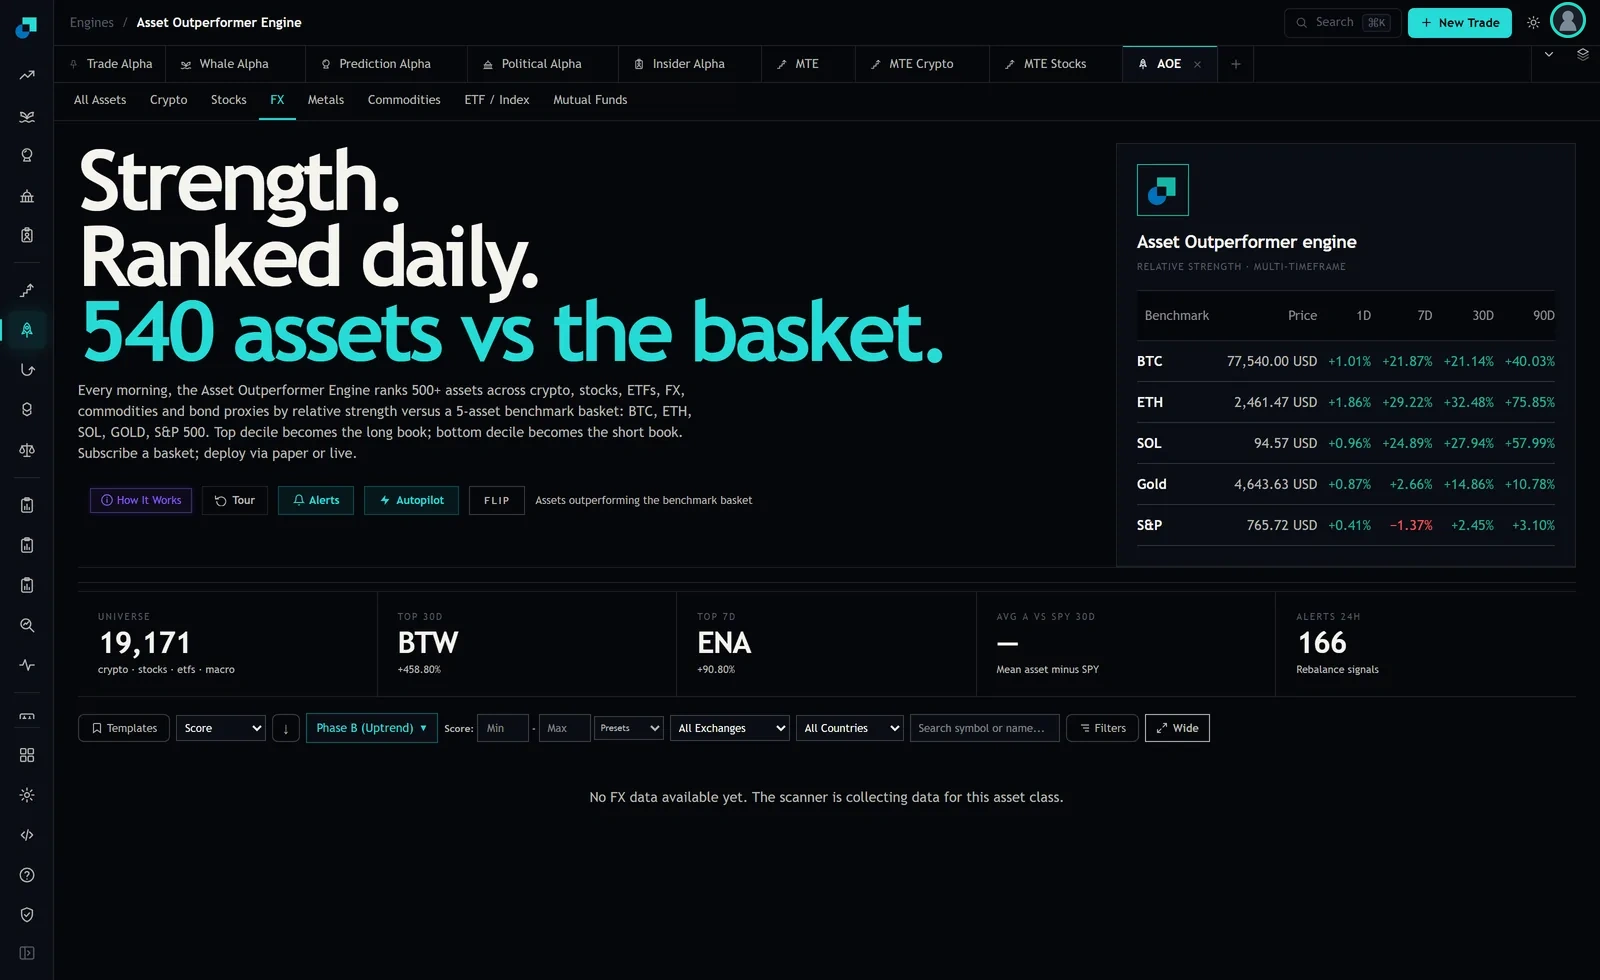
The summary tiles across the middle of the page set the scale better than any explanation. At capture the universe tile read 19,171 across crypto, stocks, ETFs and macro. The top thirty day mover tile read BTW at plus 458.80 percent. The top seven day tile read ENA at plus 90.80 percent.
That is the neighbourhood the scoring scale was built in. Nearly five hundred percent in a month sits at the top of the range, and ninety percent in a week is a strong but unremarkable entry near it. On the stocks tab the numbers are smaller and still large by any normal standard: a ninety day figure of plus 553.24 percent on one row, plus 92.09 percent over thirty days on another.
A currency pair does not have those numbers to give
Major currency pairs move in single digit percentages over the course of a year. A two percent move in a month is a substantial month. A five percent move in a month is a story, and a ten percent move in a month is a currency crisis that people will still be referring to a decade later.
Set those next to the tiles above and the arithmetic is one sided in a way no amount of currency skill can fix. The strongest month a major pair is realistically capable of producing is roughly a fiftieth of what the top row on this board did over the same window. If a score is a position within a distribution, and the distribution runs from zero to several hundred percent, then everything that lives inside a two percent band gets compressed into the bottom of the scale together.
This is not a flaw in the currency and it is not a flaw in the engine either. It is what happens when you put assets with fundamentally different volatility onto one axis. The same effect, in a milder form, is why a utility stock rarely tops a momentum screen that includes small cap biotech.
The benchmark basket makes it stricter still
Now add the second effect, which is about the bar rather than the scale. Every asset in this engine is scored against the same five benchmarks, and those benchmarks are not calm.
Over thirty days at capture the panel read BTC up 21.14 percent, ETH up 32.48 percent, SOL up 27.94 percent, gold up 14.86 percent and the S&P up 2.45 percent. Four of the five benchmarks moved by more than a currency pair moves in a typical year. So in that particular month, a currency could have had one of the best months in its recent history and still lost the comparison against four of the five things it was being measured against.
The breadth count on this board runs out of fifteen, five benchmarks across three timeframes, so nine of those fifteen checks are crypto checks. In a month like that one, an FX row would lose all nine before the equity and gold checks were even reached. A count of two or three out of fifteen would be the ceiling, and a count of two or three looks like failure on a board where the top rows show seven, eight and twelve.
Turn the month around and the effect reverses just as hard. In a stretch where crypto is down twenty percent, a currency that does nothing at all wins nine checks for free and its score jumps. Neither reading tells you anything about the currency. Both tell you about crypto.
Read FX inside its own tab, and only there
The engine gives you the tool for this in the type selector across the top: All Assets, Crypto, Stocks, FX, Metals, Commodities, ETF and Index, and Mutual Funds. Those tabs are not just filters on a list, they are the boundary of a fair comparison.
Within a peer set, a score is comparable. Two currency pairs measured the same way against the same basket over the same window can be ranked against each other, and the fact that both scores are low tells you nothing except that both are currencies. The gap between them is the signal, and the gap is readable even when the absolute level is not.
Across peer sets, a score is not comparable at all, and the all assets board is where people forget that. A currency showing 22 and a token showing 68 on that board are not two rungs of one ladder. They are two different measurements that happen to share a number line, and treating the token as three times better is exactly the mistake the shared scale invites.
The rule that follows is short. Sort within the tab, compare within the tab, and never carry a score from one tab into a sentence about another. If you want to know whether the euro is strong, the only useful comparison is other currencies. If you want to know whether to hold a currency instead of a token, that is an allocation question and a relative strength score is the wrong instrument for it.
What to do while the FX tab is collecting data
There is an honest complication. At capture the FX tab was not populated. Opening it returned a single line stating that no FX data is available yet and that the scanner is collecting data for this asset class. So the within-tab comparison this section recommends is not available to run today, and anyone telling you what the engine's FX scores currently say is describing something that is not on the page.
The workaround is the same arithmetic, done by hand, on the two benchmark legs that are live. Take the pair's move over thirty days from your broker. Take gold's thirty day figure and the S&P's thirty day figure from the benchmark panel, which read plus 14.86 and plus 2.45 percent. Divide one plus the pair's return by one plus each benchmark's return and subtract one. That gives you the currency's performance against gold and against equities, which are the two comparisons that mean something for a currency holder.
Keep the crypto legs out of your own version. Not because they are uninformative in general, but because for a currency question they will dominate the answer nine checks out of fifteen and tell you about a market you are not asking about. The reason the FX read has to happen inside the FX tab is the same reason it should happen against gold and equities when you do it manually, which is that a comparison is only useful when both sides of it operate on a similar scale.
Then watch the tab. When rows appear, check the first thing you see against your own sheet before you trust the scores, and expect the numbers to look small. Small is the correct output for a currency here, and knowing that in advance is what stops you from reading a 20 as a verdict.