There is a category of process error that shows up in every mixed-frequency indicator and almost never gets named in the investment policy statement. The number refreshes faster than it informs. A dashboard can honestly render a new value every morning while the underlying evidence set has not changed since the last official release, and a book that resizes off that render inherits variance it cannot attribute to anything.
The Macroeconomic Risk Scorecard is a clean example. Seven recession probability models over more than fifty macroeconomic indicators, pulled from FRED, the BLS, the BEA and the ECB, plus credit stress measures and the dollar index. The combined M7 score reads 29 out of 100 today. The question this piece is about is not whether 29 is right. It is how often you are entitled to act on it.
A composite inherits the clock of its slowest informative input
Sort the inputs by release frequency and the problem becomes obvious. Credit default swap levels, high yield spreads and the dollar index move continuously through the trading day. Inflation prints, labour data and the output series arrive monthly, some of it quarterly, all of it with a publication lag and much of it subject to revision. Central bank balance sheet data arrives on its own weekly and monthly schedules.
So on a random Tuesday with no releases, any movement in the composite is coming entirely from the market-priced minority of the inputs. That movement is real in the sense that the inputs really moved. It is not new information about recession risk, it is the same information about market pricing that you already have in your positions, in your marks and in every other risk system you run.
The useful framing is that the composite has two components with different half lives, and a daily reading gives you the fast one at full weight and the slow one stale. If the reason you consult a macro composite at all is that you want the slow signal, taking it daily is drawing from the wrong half of the distribution.
What the daily number is actually telling you
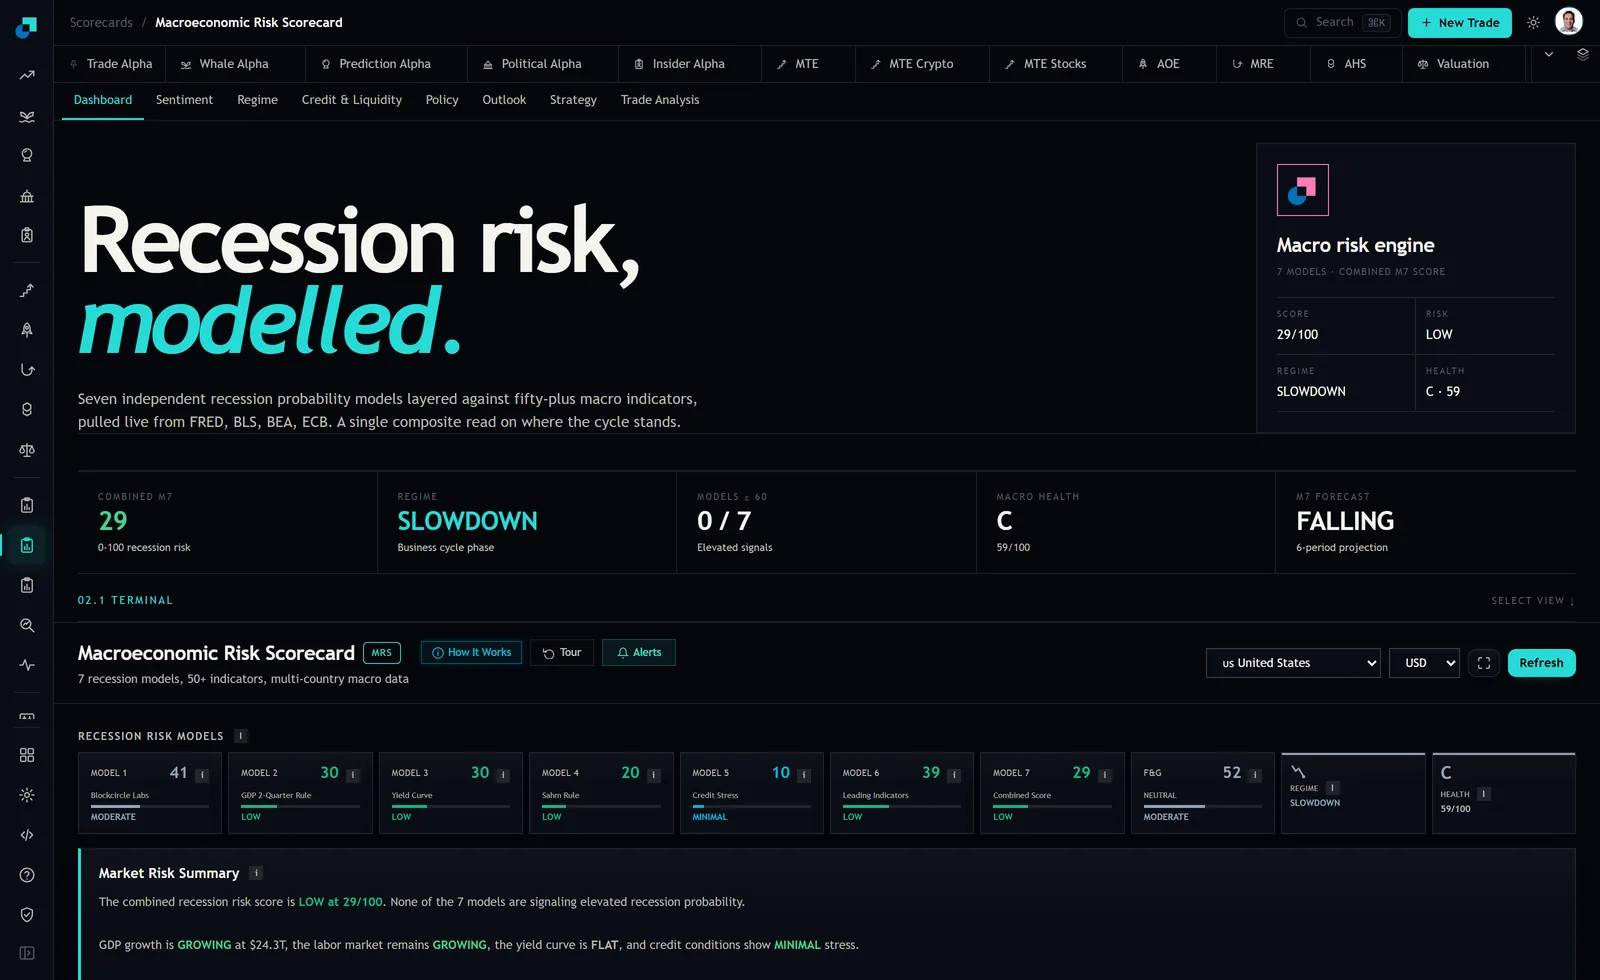
Look at the tiles in that order. The regime label reads SLOWDOWN and is described as the business cycle phase, which is by construction a designation that should hold for quarters at a time. The health grade sits at C. The combined score is 29. Those objects have wildly different natural frequencies and they are presented side by side, as they should be on a dashboard, which makes it easy to read all four with the same urgency.
The practical test I apply is this. If the number moved and no macro series was released since I last looked, then whatever moved is already in my P and L. Acting on it is not a macro overlay, it is a second, slower, worse expression of a market view I am already carrying.
The turnover the render calendar creates
Put numbers on it, because the effect is larger than intuition suggests. Suppose your policy scales gross exposure linearly with the composite, from full gross at a score of zero down to sixty percent gross at a score of one hundred. That is 0.4 percent of gross per index point, which is a reasonable, unaggressive mapping.
Now assume the composite wanders an average of three points a day between releases. That is an assumption, not a measurement, and I am using it to show the shape of the cost rather than to state a fact about this series. Three points a day at 0.4 percent per point is 1.2 percent of gross traded daily, one way. Across roughly 250 trading days that is about 300 percent of one-way turnover a year. At an all-in ten basis points per one-way notional, you have spent about thirty basis points of NAV.
Run the same mapping monthly. Assume the month-over-month change averages four points, larger per observation because more has genuinely happened. That is 1.6 percent of gross per month, about nineteen percent of turnover a year, roughly two basis points of cost.
The gap is roughly twenty eight basis points a year for the same policy, the same model, the same view. Every one of those basis points is paid to observe a number more often than it learns anything. And that is before you count the operational load, the reconciliation, and the fact that a book which trades daily on a macro input generates a daily audit trail that somebody has to be able to explain.
Set the cadence, then build the exception you are allowed to use
The cadence rule is straightforward: observe on the release calendar, not the render calendar. In practice that means one scheduled observation a month, taken on a fixed day chosen to sit after the main monthly data has landed, with the reading timestamped and stored.
The objection to this is legitimate and needs an answer. Markets break faster than monthly, and a process that has committed to looking once a month has committed to being late. So write the exception explicitly rather than leaving it to whoever is in the room.
- An off-cycle observation is permitted when a named credit or liquidity condition triggers, defined in advance on the credit and liquidity inputs rather than on the composite.
- An off-cycle observation is permitted on a policy event that was not on the scheduled calendar.
- An off-cycle observation is not permitted because the score moved. That is the entire discipline in one line, and it is the one people break.
Notice what the exceptions have in common. Each is defined on a specific input with its own fast clock, so you are reacting to the fast data as fast data, not laundering it through a slow composite that was never designed to carry it.
Cadence is a control, so document it like one
Written into the investment policy statement, a cadence rule does three jobs at once. It caps the turnover that can be generated by the macro overlay, which makes the overlay's capacity calculable. It gives you a dated series of observations rather than a continuously varying quantity, which is the only form in which a macro decision can later be audited. And it makes the exception path visible, so an off-cycle de-risking is a documented departure with a named trigger rather than a judgement call that has to be reconstructed from memory.
The cost of this is real and should be stated in the same document. In a genuine fast break you will be, on average, a couple of weeks late relative to a daily process, and in the worst case nearly a month. You are accepting that lateness in exchange for not paying thirty basis points a year to trade on the difference between Tuesday and Wednesday. If the committee is not willing to accept that trade, the honest conclusion is not to raise the observation frequency. It is that the macro overlay is being asked to do a job, tactical risk reduction inside a week, that a monthly-paced composite of official statistics was never built to do, and that job belongs to a different instrument.