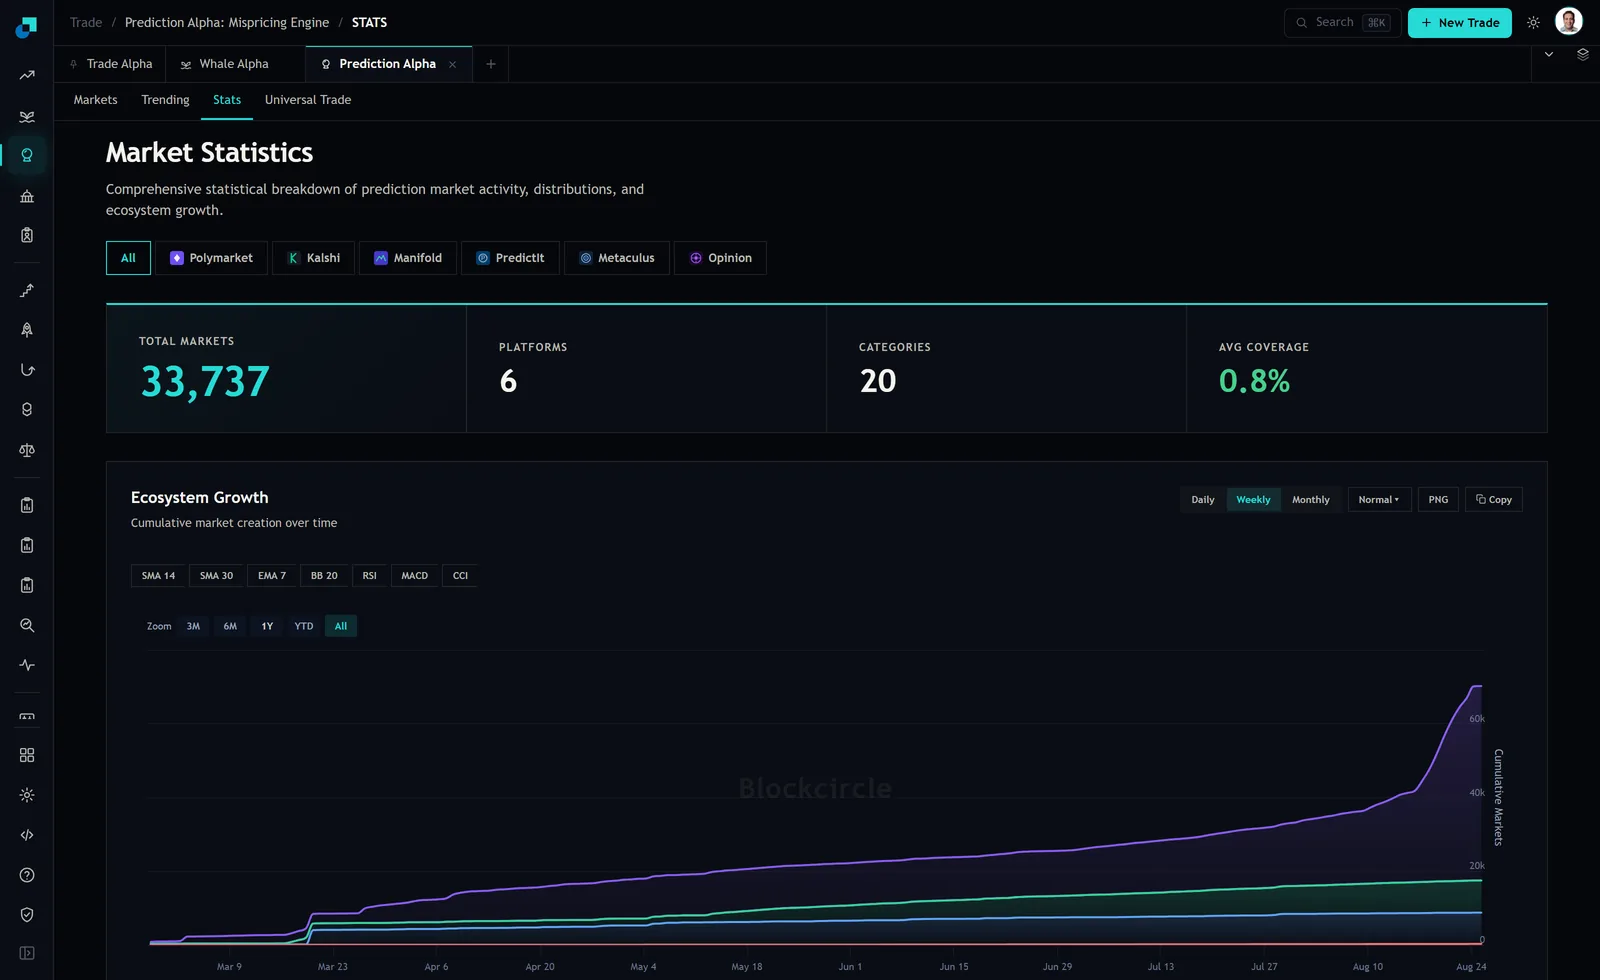
The stats tab in Prediction Alpha carries a chart called Ecosystem Growth, described underneath as cumulative market creation over time. For most of its history it is a pleasant, boring line climbing at a steady angle. Then, in the last stretch before the capture, it goes nearly vertical.
Whatever caused that, it is a supply event. More questions to trade is not obviously bad news for somebody looking for things to trade. It becomes bad news the moment you ask the second question, which is whether the money in these markets grew at the same rate, and that is a question the page cannot answer.
What the curve counts, and what it does not
Cumulative means the line never falls. A flat stretch is not a stable market count, it is a period with no new listings, and the resolved and expired contracts stay in the total forever. So the height of the curve is the number of markets that have ever been created, not the number you can trade today.
The chart is bucketed weekly in this capture, with daily and monthly options and an all history zoom selected. It carries several series, one per venue plus a total, which is why some lines sit far below others.
The important limitation is the axis label. It says Cumulative Markets. It does not say deposits, open interest, or resting liquidity, and there is no series anywhere on that page for the money. You are looking at the supply side of this market with the demand side missing, and every conclusion below has to respect that.
The ten days that changed the slope
Reading the endpoints off the axis in that screenshot: the top series is around 30,000 in mid July, around 36,000 by August 10, near 40,000 a few days later, and finishes a little above 66,000 on August 24. That is roughly 26,000 additional cumulative listings in about ten days, on a curve that had taken five months to reach 40,000.
Before reading anything into it, note that the same page gives three different counts of markets. The Total Markets tile above the chart reads 33,737. The markets tab reports 56.2K markets indexed across six venues. And the top series of this chart alone finishes above 60,000. Those are three definitions, not three errors, and if you are going to quote a number to somebody, quote which one you mean.
A jump like that is a listing programme, a new venue integration, or a change in what the system counts as a market. It is not thousands of new traders arriving at once. Nothing on the page proves deposits did not keep pace, and I am not going to claim they did not. What is worth doing is working out what it costs you if they did not, because that arithmetic is cheap and the answer is uncomfortable.
Depth per market is a division problem
Think of the resting capital across a venue as one pool. Average depth per market is that pool divided by the number of live markets. Add markets and hold the pool constant and average depth falls proportionally. Add 26,000 listings against a pool that grew by ten percent and the average book gets thinner by a lot, even though nothing bad happened to anybody.
You can see roughly where the distribution already sits without any of that arithmetic. On the markets tab, four of the highest turnover rows in the entire feed showed resting liquidity of 497.3K, 686 dollars, 648.8K and 282.0K. Those rows are the top of the turnover distribution. If a market doing three quarters of a million dollars of daily volume can be sitting on 686 dollars of book, then the middle of the distribution is thin and the tail has essentially nothing in it.
That is the shape you should expect a supply glut to push further. Not a general collapse, but a widening gap between a few marquee questions that keep their depth and a much longer list of listings where the book is a rounding error.
What a thin book does to your fill
Three things happen, and the third is the one that matters.
The spread widens, which you can see before you trade. The size available at the touch shrinks, which you can also see if you look at the depth rather than the quote. And your exit gets expensive, which you cannot see until you need it.
That last one is specific to binaries and worth being precise about. On a fixed payoff instrument, the price you pay is your maximum return. Buy at 30 cents and the best case is 70 cents of profit on 30 cents of capital. Let impact drag your average fill to 34 cents and the best case drops from 233 percent to 194 percent, before you have been right or wrong about anything. Slippage on a binary is not a cost line next to your return, it is a direct subtraction from the ceiling.
Then run the exit. On the row quoted 0.9 against 99.1, the resting book was 686 dollars in total. A 200 dollar order is 29 percent of everything there. You will not exit that at the quote, and on a market whose entire trading history happened in the last 24 hours there is no reason to assume a deeper bid arrives tomorrow.
Three habits for a market with more listings than money
Screen on liquidity, not on interest. Sorting by 24 hour volume finds you markets that are busy today, which in a supply glut increasingly means markets that were listed today. Put a hard liquidity floor in dollars on your screen and apply it before you read a single question title. If nothing clears the floor in your category, that is the answer for the week.
Check total volume against 24 hour volume on every candidate. When those two figures are nearly equal, the market has no history: everything that has ever traded in it traded in the last day. Two of the four rows in the capture were in that state, at 796.4K against 796.8K and 750.6K against 751.0K. A price with no history behind it is a quote, not an estimate.
And set an exit rule in advance, expressed as a percentage of the book. Mine is that I will not open a position larger than a stated small share of visible resting liquidity, and I check it against the Liquidity column before the ticket rather than after. A rule like that costs you the occasional interesting trade in a thin market. In a market where listing supply can grow sixty percent in ten days, being the person who cannot get out is a far more expensive way to learn the same lesson.