The narrowest column on the Asset Outperformer board is the one I look at second, right after the score, and it is the one most people skim past because it holds a single small integer. That integer is the #Out count, and it is not a rating anybody assigned. It is a tally. The engine compares every asset against five benchmarks, Bitcoin, Ethereum, Solana, Gold and the S&P 500, and it runs that comparison across three timeframes. Five times three is fifteen, so the cell can only ever hold a number from 0 to 15, and it tells you how many of those fifteen individual contests the asset won.
Five benchmarks, three timeframes, one integer
Once you know the arithmetic, the column stops being decorative. A 15 means the asset beat every one of the five benchmarks on every one of the three horizons the check uses. A 0 means it lost all fifteen. An 8 means it won a bit over half, and the interesting question is immediately which eight.
That last question is where the count earns its keep and also where it runs out of road. The cell gives you breadth, the number of contests won. It says nothing at all about margin, the amount by which each was won. Two assets can both show 8 and be completely different animals: one that scraped past four benchmarks by a tenth of a percent and genuinely ran away from four others, and one that beat everything it beat by a hair. Margin is not something the count can give you, and on the All Assets board there is no cell that hands it over either. What you have alongside the count are the per-period return columns, 1D through 90D, plus Conviction sitting next to Score. So the margin read has to be assembled: take the count as the breadth reading, then look along the return columns to see whether the wins were decisive or marginal. Two rows showing the same 8 will usually look nothing alike once you do that.
Why 14 out of 15 can be worth less than 8
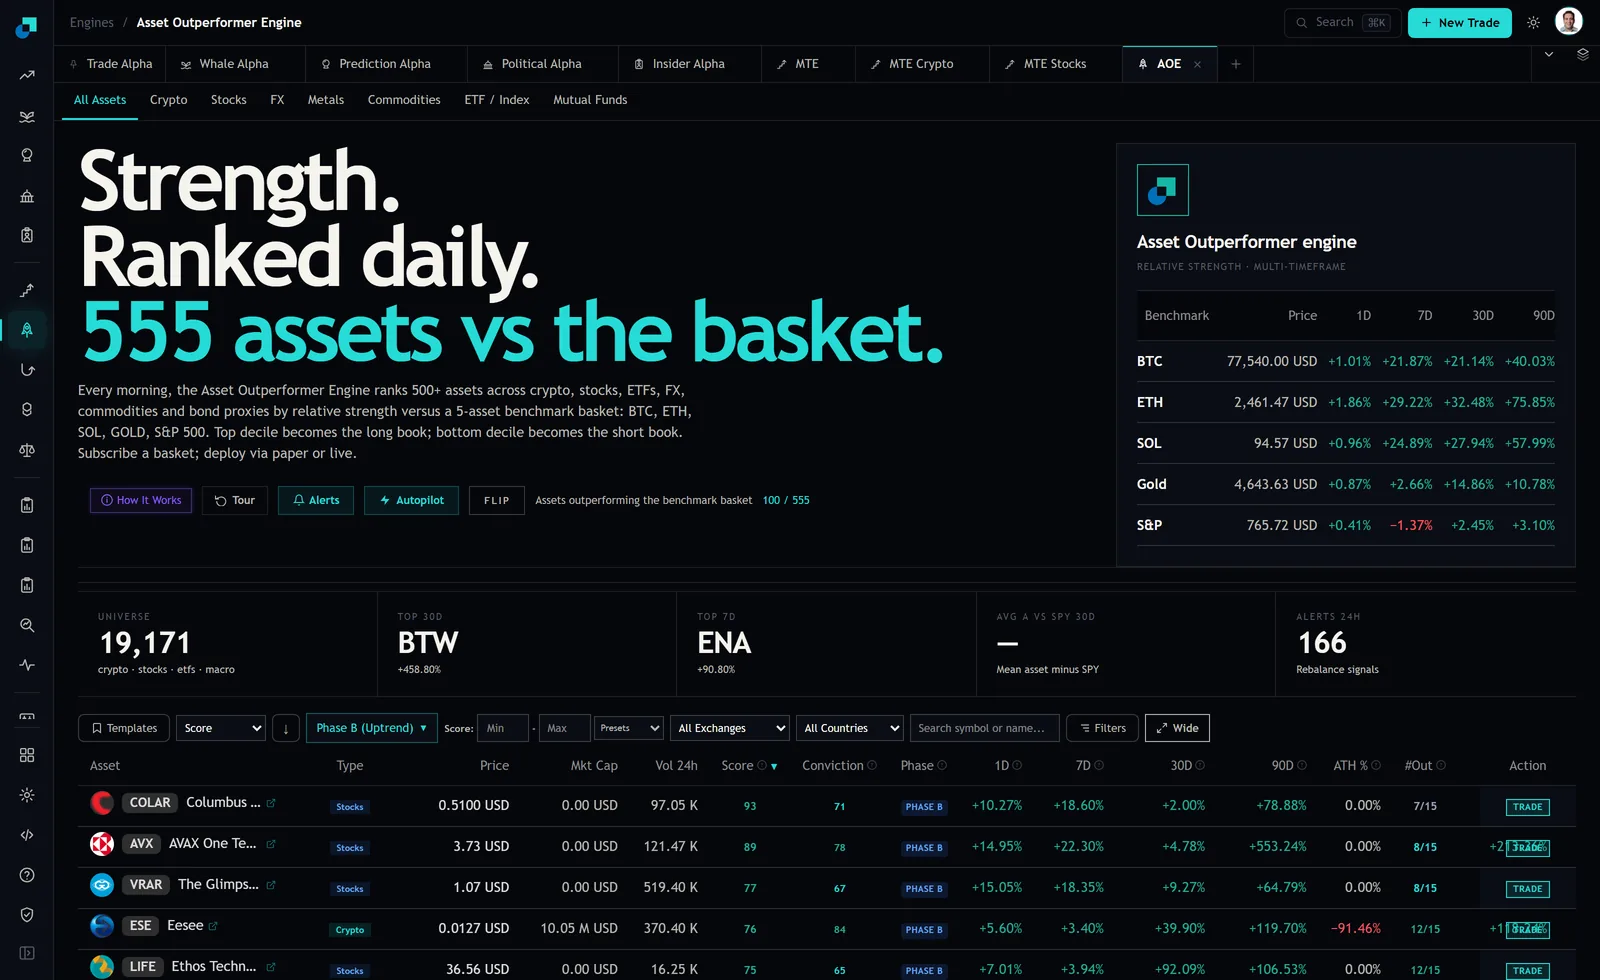
The capture above makes the point without any argument from me. On the board at the time of writing, COLAR held the top score at 93 with a 30-day move of +2.00%. Four rows down, LIFE carried a 75 on +92.09% over the same window. CRWN scored 85 on +0.80%. If breadth were the whole story, the ordering would look absurd. It is not absurd, because a high count built from consistent, tiny wins is a real thing the engine is designed to find, and so is a lower count attached to one enormous move.
Which of those you want depends entirely on what you plan to do next. If you are looking for something to hold for a few weeks and you care about not being whipsawed, breadth is the better property and a high count with a modest average beat is exactly right. If you are hunting for the thing that is actually moving, the count is close to noise and the average outperformance figure is your column. The mistake is treating a 14 as strictly better than an 8 without ever opening the other two cells.
There is a related trap in the other direction. A very high count on an asset whose price barely moved usually means the benchmarks had a poor stretch rather than the asset had a good one. The count is relative by construction. Every value in it is a statement about the gap, never about the asset in isolation.
The benchmark that is actually setting the bar
Because the five benchmarks are tested individually, they are not equally hard to beat, and the difficulty changes week to week. The benchmark strip at the top of the module makes this legible. On the reading I am working from, the S&P line showed +2.45% over 30 days and +3.10% over 90 days, while ETH showed +32.48% and +75.85% across the same two windows. BTC showed +21.14% and +40.03%, SOL +27.94% and +57.99%, Gold +14.86% and +10.78%.
Sit with those numbers for a second, because they change how you read every count on the board. In that particular stretch, beating the S&P was close to free. Beating ETH over 90 days meant clearing roughly seventy five percent. An asset showing 9 out of 15 in that environment may well have won every S&P and Gold contest and lost every crypto one, which is a very specific description of what it is: something that is holding up against traditional assets and getting run over by crypto. A different asset also showing 9 might have done the exact opposite. Same integer, opposite meaning.
So the count is a starting point that you finish by hand. When a name matters to me, I read the benchmark strip first, decide which of the five I actually care about given what else I own, and then treat the count as a rough prior rather than an answer.
Using the count as a filter rather than a score
The workflow that gets value out of this column is short. Sort the board by Score to get a sane starting order, then scan the count and the average outperformance column together and throw away anything where the two disagree in a way you cannot explain. High count and thin average is a slow grinder, fine if that is what you came for. Low count and huge average is a single-benchmark story or a single-timeframe spike, and it needs a chart before it needs a position.
Two structural details are worth holding in your head while you do this. The engine runs a full scan every six hours, so the count you are looking at is a snapshot from within the last six hours and not a live tick. And the module ships with an asset classifier that excludes meme coins and stablecoins from results by default, which you can toggle in the advanced filters. If you turn that off, expect the count distribution to change character, because a stablecoin will reliably lose fifteen out of fifteen in any rising market and tells you nothing.
The check I run before acting on a high count
The count says nothing about whether you can trade the thing, and this is where a small account gets hurt. The board mixes venues and sizes freely. On the crypto tab at capture, ESE scored 76 at a market cap of 10.05 M USD, and further down HTR sat at 68 on 1.79 M USD. A 15 out of 15 on a token with a market cap in single-digit millions is a real reading of relative strength and also an asset where a few thousand dollars is a meaningful fraction of what trades. The count cannot see that. You have to.
So before I act on any high count, I do three things. I check the market cap and volume cells on the same row, because the count is blind to both. I open the type tab, crypto or stocks or ETF, rather than working from All Assets, because the combined view is a mixed population and comparing a micro-cap token against a listed ETF on a single integer is not a comparison. And I ask what would have to be true for the count to fall, which for a name at 14 or 15 usually means the answer is that the benchmarks stop being weak, not that the asset breaks.
That last question is the useful one to sit with. A count near the top of its range has nowhere to go but down, and the thing that moves it is often the benchmark rather than the holding. If you bought breadth, you should expect to lose breadth first and price second, and the count gives you that warning a good while before the 30-day column does.