The Sector Flow tab collapses a week of Form 4 buying into ten rows. That is a small enough number of things that a person with a job can actually check it once a month, and it maps almost exactly onto the sector funds that trade with penny spreads all day. Those two facts together are what make a rotation sleeve plausible on a small account. What makes it fragile is that the panel gives you two different rankings and does not tell you which one to use.
The board the sleeve reads from
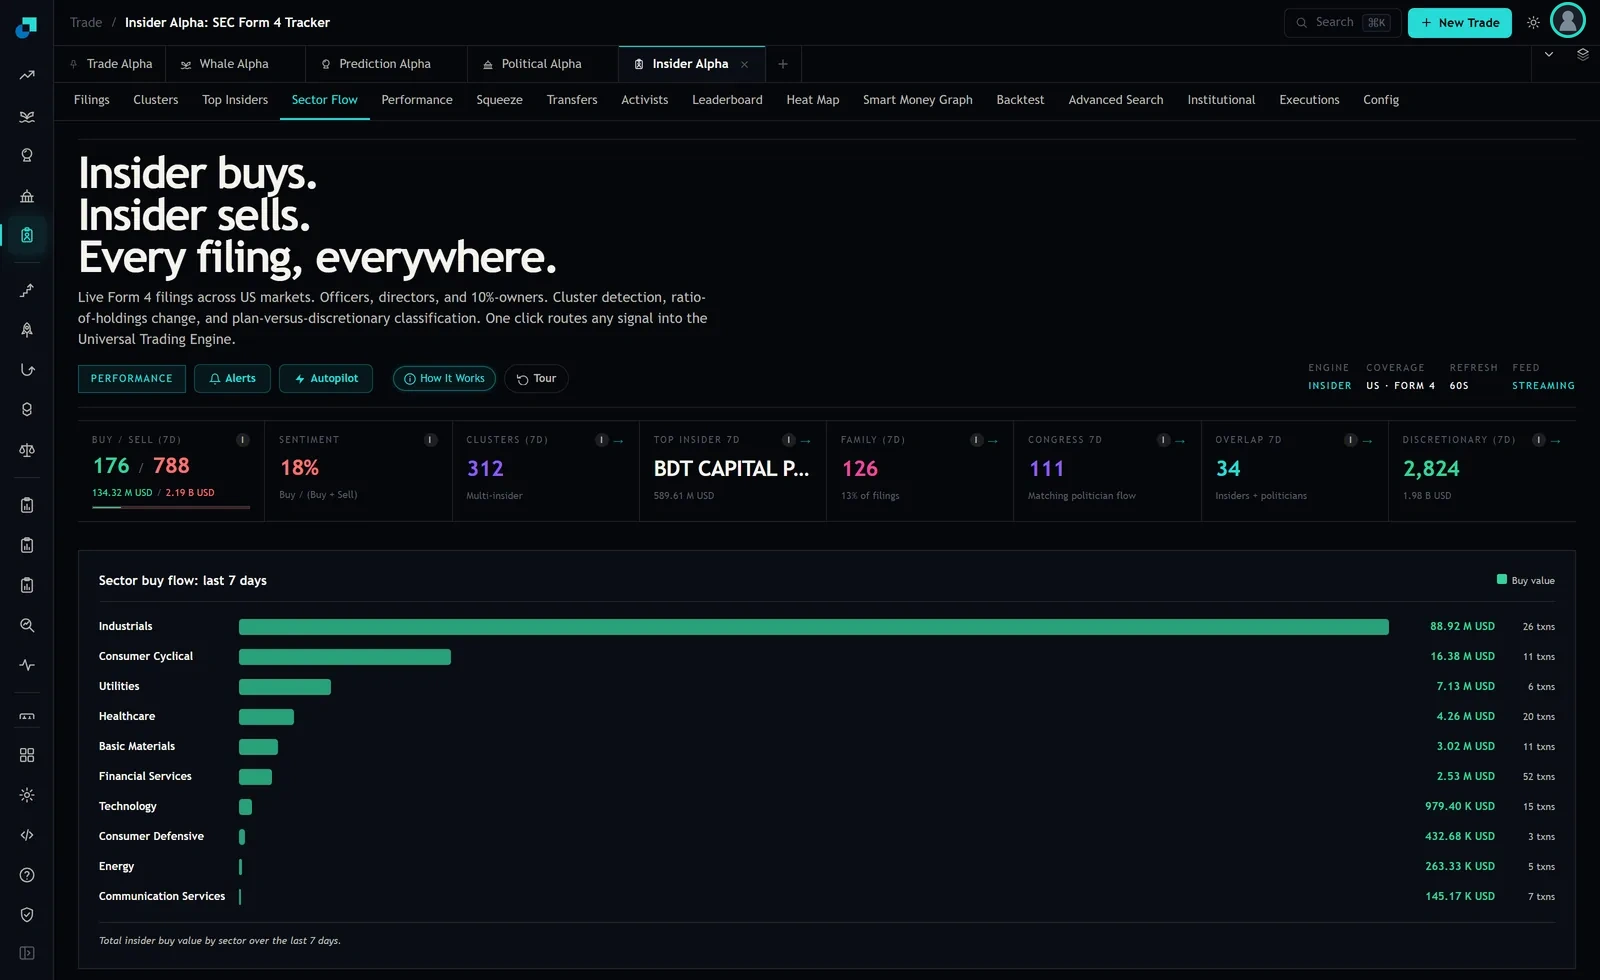
Here is the panel as captured, headed Sector buy flow: last 7 days, with total insider buy value and transaction count per sector. Industrials, 88.92 M USD across 26 transactions. Consumer Cyclical, 16.38 M USD across 11. Utilities, 7.13 M USD across 6. Healthcare, 4.26 M USD across 20. Basic Materials, 3.02 M USD across 11. Financial Services, 2.53 M USD across 52. Technology, 979.40 K USD across 15. Consumer Defensive, 432.68 K USD across 3. Energy, 263.33 K USD across 5. Communication Services, 145.17 K USD across 7.
Add the dollars and you get about 124.1 million. The buy tile at the top of the page read 134.32 M USD across 176 buys for the same seven days, and the sector rows account for 156 transactions. So roughly ten million dollars and twenty transactions did not land in a sector bucket. That gap is small enough to ignore for a tilt and large enough that you should not present these ten rows as a complete census of the week.
Dollars and transactions disagree, and you have to pick
Rank those ten rows by dollars and Industrials is first by a distance: 88.92 million out of 124.1 million is about 72 percent of the entire week's insider buying, from 26 transactions. Rank the same rows by transaction count and Financial Services is first with 52, a third of all transactions, from 2.53 million dollars, which is about two percent of the money.
Those are not two views of the same thing. The dollar rank is telling you where a small number of large cheques landed. Divide Industrials through and the average purchase was about 3.4 million dollars. The count rank is telling you where a lot of people did something small: the average Financial Services purchase was under 50 thousand dollars. One sector had a handful of people making decisions the size of a house purchase each. The other had fifty-odd people making decisions the size of a car.
Pick one and write it down. My preference for a small account is the transaction count, for a reason that has nothing to do with which predicts better and everything to do with robustness: a dollar ranking can be flipped by one filing. If a single sponsor buys 90 million dollars of an industrial name on a Thursday, the dollar chart says rotate into industrials, and it is saying that on the strength of one person's decision. Fifty-two separate purchases are harder to produce by accident.
Mapping ten rows onto things you can actually buy
Every one of these ten buckets has a large, liquid US-listed sector fund tracking it. The SPDR select sector series covers industrials, consumer discretionary, utilities, health care, materials, financials, technology, consumer staples, energy and communication services, which is a one-to-one match with the ten rows on this panel. There are competing funds from other issuers for most of the same exposures.
Two things to check yourself rather than take on trust, because they change over time and I am not going to quote figures that will be stale by the time you read this. Look at the current expense ratio on the fund's own page, and look at the quoted spread and the average daily volume in your broker before you place an order. For the largest sector funds the spread is typically a cent or so on a share price in the tens of dollars, which is single-digit basis points each way. That is small enough to rebalance monthly and much too large to rebalance daily.
Also note what the mapping does not preserve. The panel's Consumer Cyclical bucket and a discretionary sector fund are not the same set of companies, and the insider buying that produced the row may be concentrated in small caps that a large-cap sector fund barely holds. You are buying a correlated proxy, not the thing that filed.
A monthly rule for five thousand dollars
Here is a version specific enough to execute and cheap enough to be worth executing.
- On the first trading day of each month, open Sector Flow and record all ten rows, both columns. Keep the record, because you will want the history and the panel shows a rolling seven days.
- Rank by your chosen key and take the top three sectors. Hold the three matching funds at equal weight, roughly 1,650 dollars each on a 5,000 dollar sleeve.
- If a sector is still in the top three next month, leave it alone. Only trade the changes. Most months this means one or two orders, not three.
- Use limit orders. On a 1,650 dollar position a one-cent improvement on a 40 dollar share price is worth about 40 cents, which is not much, but market orders in a thin session cost considerably more than a cent.
The turnover here is the point. If the top three change completely every month, you are doing 36 round trips a year on a 5,000 dollar sleeve, and at a few basis points each that is still a small drag, but the tax reporting on a taxable account is not small in terms of your time. Only trading the changes usually cuts that by half or more.
What this sleeve cannot do for you
Be honest with yourself about the size of the claim. This is a tilt derived from a seven day window of filings, and seven days is short. Insiders buying industrial companies is not a forecast that the industrials sector fund will rise, and there is nothing on this panel that says it is. The panel's own footer describes what it shows without any further claim: total insider buy value by sector over the last seven days.
The specific ways this goes wrong are worth naming. A single enormous purchase can define a sector's rank, which the dollar column is vulnerable to and the count column is less so. A sector where insiders bought heavily may already have moved by the time the filings are public. And the whole sleeve is long-only sector beta, so in a broad drawdown it will do exactly what the market does, regardless of what the filings said.
Treat it as a way of deciding which third of the market to be overweight rather than as a signal about direction. If your alternative was a broad index fund, the honest question to ask after six months is whether the three-sector sleeve did anything the index did not, and whether the difference was worth the twelve mornings you spent on it.