An MRE row that reads OVERBOUGHT, SHORT, SCALP on BTC/USD tells you the composite fired. It does not tell you which of the three engines underneath it did the work, and that is the part that should change what you do next. A reversal score driven by momentum behaves nothing like one driven by liquidity, even when both print the same red badge on the same row at the same minute.
The module names its own inputs on the page, which is more than most signal products do. AMS is the Altcoin Market Scorecard, combining eleven breadth and on-chain metrics. MMS is the Multi-Timeframe Momentum Scorecard, running across six timeframes. GLS is the Global Liquidity Scorecard, tracking eight central bank balance sheets. Three different questions, sampled at three different speeds, compressed into one badge.
What each engine is actually counting
AMS counts participation. Eleven breadth and on-chain metrics is a measure of how many things are moving, not how far any one thing has moved. When the AMS leg is the stretched one, the claim the engine is making is about the crowd: a lot of assets got extended together, and crowds that get extended together tend to thin out together.
MMS counts agreement between horizons. Six timeframes looking at the same instrument will normally line up in a real trend. A reversal reading from MMS is the statement that they have stopped lining up, which usually means the shortest horizons rolled over while the longer ones are still pointing the old way. That divergence is the thing the module describes on its own page as multi-timeframe divergence detection, alongside RSI bands, Bollinger extremes, volume climax and key-level rejection.
GLS counts money. Eight central bank balance sheets is not a trade timing input in any normal sense. It is the backdrop against which everything else is happening, and it moves on the schedule that central banks publish on, not on the schedule your chart updates on.
The three legs run on three different clocks
MRE scoring updates on every supported timeframe close, and that cadence applies to the composite. The data feeding each leg does not move at the same rate. Momentum on a fifteen minute chart genuinely changes every fifteen minutes. Breadth and on-chain metrics move over hours and days. Central bank balance sheet data is published on a weekly to monthly reporting cadence, so whatever the liquidity leg reads at 21:11 tonight will read approximately the same at 21:11 tomorrow.
There is a consequence of that which almost nobody thinks through. Over the life of a fifteen minute scalp, the slow leg is not really contributing to that individual signal. It is contributing the same level it contributed to every other signal this week. A three-leg composite where one leg is near constant across the horizon of the trade is functionally a two-leg composite with a bias term attached, and the bias term is doing exactly as much work in the setup you take as in the setup you skip.
That is not a criticism of including it. Knowing the money backdrop is worth having. It is an argument about what you can conclude from the score moving, which is the next section.
Naming the leg without opening anything
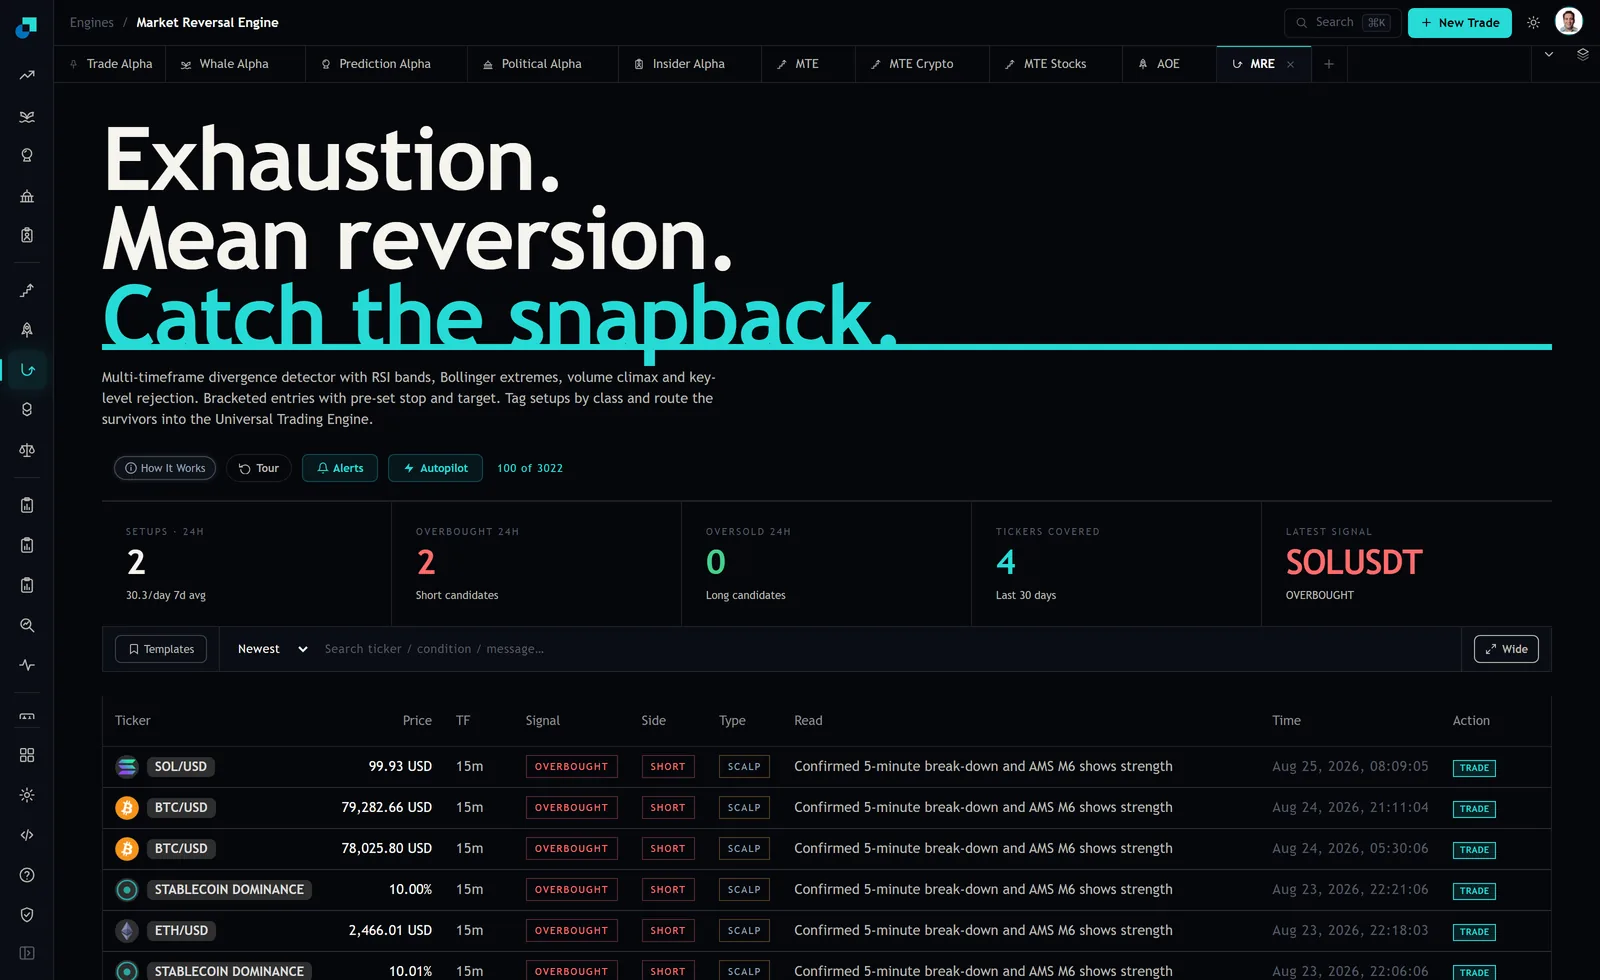
You can usually name the responsible engine straight off the dashboard, because the labels carry the engine in front. In the capture above, the Latest Signal tile reads AMS M3 on BTC/USD, tagged OVERBOUGHT. The Read column on the top rows says the break was confirmed on the five minute chart and that the AMS M6 reading shows strength. The engine name is right there in both places.
Notice what those five rows have in common. Same timeframe of 15m, same OVERBOUGHT signal, same SHORT side, same SCALP type, same Read text, across BTC/USD twice, stablecoin dominance twice and ETH/USD once, all inside about a day. If you treat that as five confirmations you have talked yourself into five times the conviction on one observation. It is one leg, saying one thing, about a set of instruments that mostly move together.
What actually changes depending on which leg fired
Momentum-led readings have the shortest useful life. The divergence that produced them is defined on bars, and a few bars later it is a different configuration. My rule is that a momentum-led setup is either taken as shipped, with the bracket the module attached to it, or skipped. There is no version where you sit on it for six hours and it is still the same trade.
Breadth-led readings deserve one extra check, and it is a check the dashboard makes easy. AMS is a statement about participation, so a breadth-led exhaustion reading with only one of the covered tickers flagged is quietly contradicting itself. On the day of the capture the tile for tickers covered read 4 over the last thirty days, so the crosscheck is a fast one. If breadth is supposedly stretched and the other covered instruments are not showing it, the leg is telling you about one asset while claiming to speak for many.
Liquidity-led readings are a sizing input. If the score crossed because the liquidity leg re-rated, the honest response for a retail account is smaller size held longer, or no trade and a note in your journal about the backdrop. Trading a fifteen minute entry off a leg that updates monthly is a category error, and it is the most common one I see people make with any composite score.
The practical version of all of this for the week: group the setup feed by the engine prefix in the Read text rather than by ticker, and cap yourself at one position per group. That single change stops the most expensive thing a composite feed does to a small account, which is selling you the same trade three times and letting you size it as though it were three.
Where a three-engine score misleads you
The first trap is treating agreement as independence. Three engines built on overlapping market data will often be stretched at the same time for the same underlying reason, and when they are, the composite feels like confirmation while actually being repetition. Confluence is only worth anything if the legs can disagree, and you find out whether they can by watching how often they do.
The second is forgetting what overbought means. A stretched reading is a statement about distance from normal, not a forecast. In a strong trend, stretched is the normal condition and it can stay that way for a long time, which is why the module ships every setup with a stop already attached rather than a target alone.
The third is the one the clock section sets up. A composite score that moves from one reading to another has not told you which leg moved. If it was the slow leg re-rating on a balance sheet update, nothing about your fifteen minute entry changed, but the number in front of you did. Score changes and trade-relevant changes are not the same event, and the composite cannot distinguish them for you.
None of the three legs, alone or combined, is a probability that your trade makes money. It is a description of how stretched a set of measurements is relative to their own history. That description is worth having in front of you before you click TRADE on a row. It is not worth more than the bracket that comes attached to it.