Scroll to the bottom of any Asset Outperformer ranking and you hit a block of rows that look broken. The symbol and name are there, the type is there, and then the price cell holds a dash, the market cap holds a dash, the score reads 0 and the phase column is empty. It looks like the engine has judged these assets and found them worthless. It has not. Almost always it has failed to price them, which is a completely different statement, and confusing the two will make you skip things you should be looking at.
A zero here is an absence, not a verdict
The composite score is calculated from price history: short-term momentum over 1, 3 and 7 days, medium-term trend over 30 and 90, long-term strength over 180 and 365, and the consistency of outperformance against the five benchmarks. Every one of those inputs requires a price series. Remove the series and there is nothing to compute, and what lands in the cell is the default value rather than a computed one.
That default happens to be zero, and zero happens to sit at the bottom of a 0 to 100 scale, which is where the confusion comes from. A genuinely terrible asset and an asset the engine could not price render identically. The dash in the price column is the tell. A scored asset always has a price. If the price cell is empty, the score beside it was never calculated.
The same ticker, blank on one tab and scored on the next
The cleanest proof of this sits in the module itself, and it is worth doing once so you stop worrying about these rows.
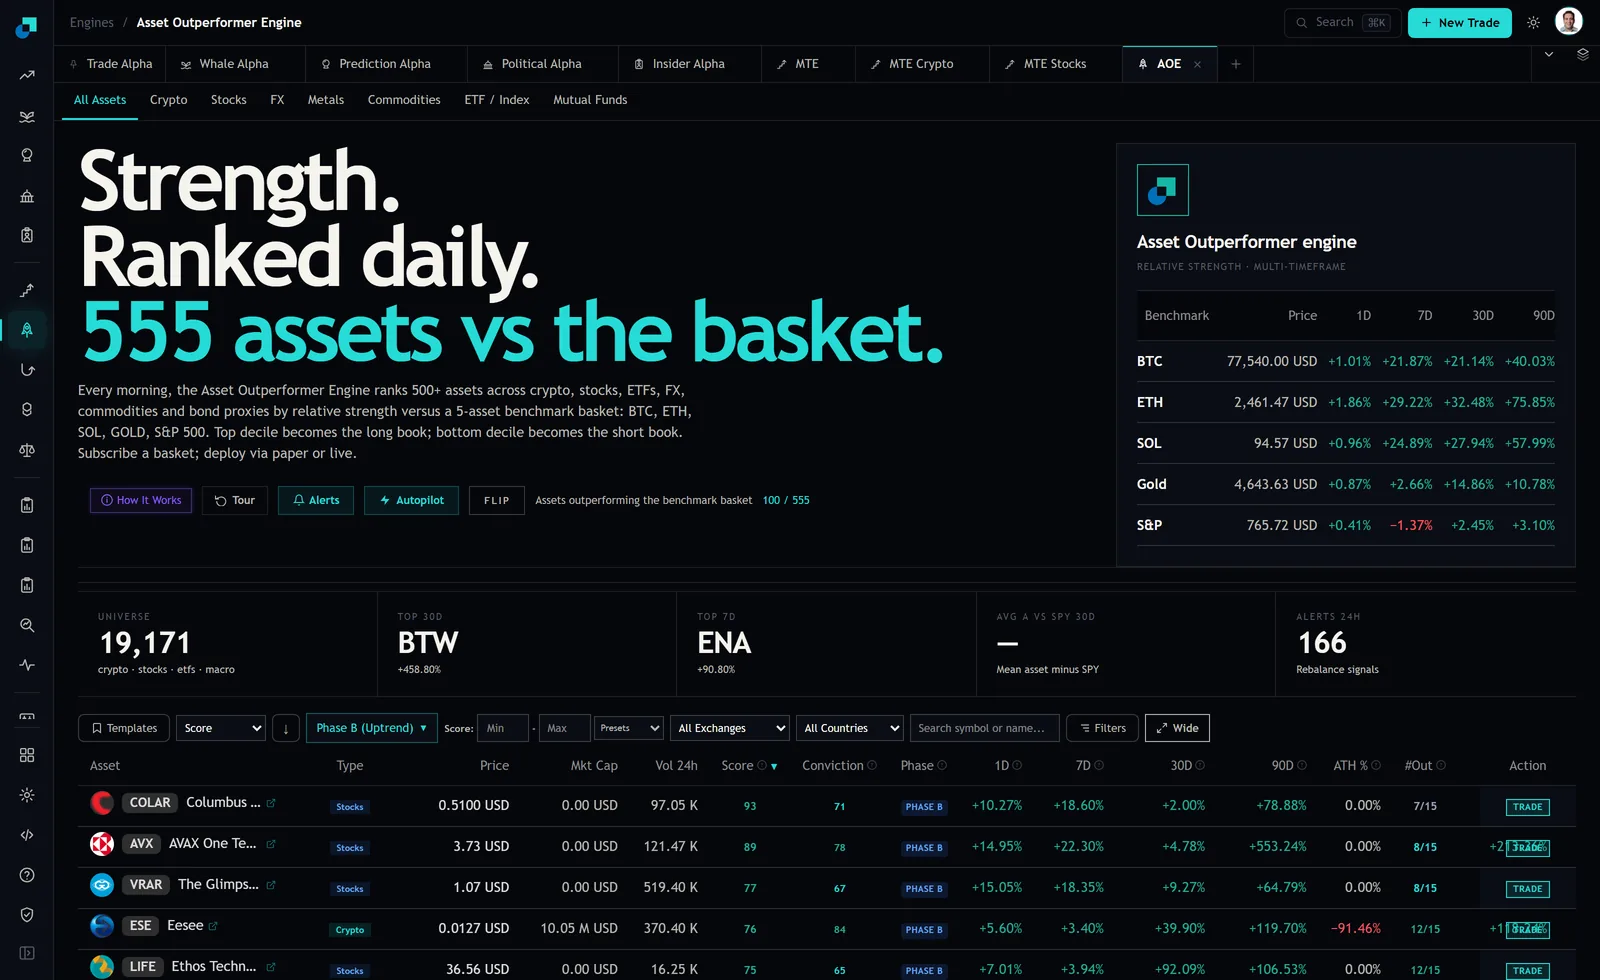
On the All Assets board at the time of writing, the unscored block included OESX, PSNL, 0GQU, AGPU, MF, NG and RDACR, all showing dashes and a zero. Switch to the Stocks tab and every one of them appears with a full row. OESX at 19.83 USD with a score of 71 and a 30-day move of +92.52%. PSNL at 17.26 USD scoring 70 on +41.24%. MF at 16.38 USD scoring 70 on +187.37%. NG at 9.40 USD scoring 70 on +58.70%.
The same thing happens in crypto. SN68 and OKB both sat in the unscored block on All Assets, and on the Crypto tab SN68 showed 5.33 USD with a score of 70 and a 30-day move of +43.30%, while OKB showed 113.30 USD, a market cap of 2.38 B USD, a score of 70 and +37.90%. OKB is not an obscure asset. It had the largest market cap on that tab.
Three different things a dash can mean
Once you accept that the zero is uninformative, the useful question is why the price is missing, and there are three common answers that need different responses from you.
The first is insufficient history. The score needs windows out to 365 days. An asset that has existed for two months cannot produce a 365-day reading, and depending on how the engine handles that, the row may not score at all. Nothing is wrong and nothing will fix itself except time. This is the usual explanation for recently launched tokens and recent listings.
The second is a stalled or missing feed for that particular view. This is what the OESX and OKB case above looks like: the data plainly exists, because the type tab renders it, so the gap is in the combined board rather than in the asset. The response is simply to check the asset on its own tab before concluding anything.
The third is a genuinely dead or suspended asset, where there is no current price because trading has stopped. This one matters and it is the rarest of the three.
Telling them apart takes about twenty seconds. Open the type tab for the asset. If it renders there with a price, you have case two and the row you were looking at was a display gap. If it is blank there too, check again after the next scan, since the engine runs a full scan every six hours, and if it is still blank across scans and across tabs you are probably looking at case one or case three, at which point the age of the asset settles which.
When a zero should actually worry you
There is a version of this that is a real warning, and it is narrow: a score of zero with a price present. That combination means the engine had the data, ran the calculation, and the asset lost every benchmark and timeframe comparison it was put through. That is a genuine reading of comprehensive underperformance and it deserves attention if you hold the thing.
Everything else in the unscored block is a data question. The distinction is entirely in whether the price cell is populated, which is why I read that column before I read the score on any low row.
One knock-on effect is worth flagging because it will bite you in the filters. The module has score presets, and the lowest of them covers 0 to 19 and is labelled as the weak band. A band with a floor of zero will collect both genuinely weak assets and unscored ones, since they carry the same value. If you use that preset to build a list of things to avoid or to short, check the price cells before treating the output as a judgement, because some proportion of it will be assets the engine never scored at all.
Working the list so blanks do not cost you
My habit is to run the type tabs rather than All Assets for anything I intend to act on. The combined board is useful for a general read across the universe, and at capture it showed a universe count of 19,171 across crypto, stocks, ETFs and macro, which is a lot of rows to render into one view. The type tabs are narrower, populate more reliably in my experience, and they also fix a second problem, which is that comparing a micro-cap token against a listed ETF on one ranking was never a comparison worth making.
Beyond that, three small rules. Never conclude anything from a zero without looking at the price cell in the same row. When something you care about appears unscored, check it on its own tab before assuming the asset is finished. And if you are building a watchlist from the bottom of the board, filter out the dashes first, because a list of things to avoid that is half populated with assets nobody priced is not a list of things to avoid. It is just noise with a low number attached.