Everyone sizing an automated profile spends their time on the per trade number. One percent of the account per position, stop placed accordingly, and the arithmetic feels settled. The number that actually decides your worst week is the one underneath it, which is how many of those positions the profile is permitted to hold at the same time, and it is the field people scroll past because leaving it empty feels like leaving the strategy free to work.
Leaving it empty does not mean no limit. It means the limit is whatever your balance happens to allow, discovered on the day the signals arrive all at once, which is reliably the same day the market is doing something that makes them all go wrong together.
One percent a trade is not one percent
Take a twenty five thousand dollar account and a per trade risk of one percent, so two hundred and fifty dollars between entry and stop on each position. That is a sensible number and it is the one you will quote if someone asks how much you risk.
Now hold seven of them at once, which is entirely normal for a momentum profile in a fast tape. The risk on the book is one thousand seven hundred and fifty dollars, seven percent, and here is the part that matters: those seven positions are not seven independent bets. They were selected by the same engine reading the same conditions, often across correlated instruments. In a broad reversal they do not resolve one by one. They gap through their stops in the same session.
So the honest way to state your risk is not one percent per trade. It is per trade risk multiplied by the maximum number of positions the profile will hold together, and the second half of that multiplication is a number you either chose or inherited. Most people inherit it.
Getting the cluster count out of your own history
The right concurrency limit is not a preference, it is a measurement, and the profile has already produced the data if it has been running. This takes about twenty minutes with the History tab and a spreadsheet.
- Export or copy the entry timestamps for the profile over as long a period as you have. Sixty days is a workable minimum, and more is better if the period includes at least one sharp move.
- Work out the average hold time for that profile. If entries and exits are both in the log this is a straight subtraction, averaged.
- Slide a window the length of the average hold across the timestamps and count how many entries fall inside it. The largest count you find is your realised maximum concurrency.
- Write down the second and third largest too, because a single outlier may be a data problem and three clustered values is a pattern.
Say the profile produced thirty four entries in sixty days, the average hold is three days, and the worst three day stretch contained seven entries. Seven is what the profile does when nobody stops it. If your per trade risk is one percent, an unlimited profile has already shown you a seven percent week and you simply have not had the week yet where all seven go against you.
Turning that into a limit, and paying for it honestly
Now go the other way. Decide the worst week you are willing to sit through, in dollars rather than percent, because percent is easy to be brave about. If a thousand dollars down on a twenty five thousand dollar account is the point where you would start interfering with the strategy, that is your real ceiling, and interfering is the outcome you are trying to prevent. A thousand dollars at two hundred and fifty a trade is four positions. Your concurrency limit is four.
Four against a realised maximum of seven means the profile would have skipped signals. Count how many. Walk the same timestamp list, simulate the cap, and tally the entries that would have been declined because four were already open. Suppose it is nine of the thirty four, about a quarter.
The question is then whether the strategy is worth running on three quarters of its signals, and usually the answer is yes. But there is a catch worth being explicit about, because it is the part that is normally left out. The skipped signals are not a random sample. They are specifically the ones that arrived during clusters, which means a concurrency cap systematically biases your participation toward calmer periods. If this strategy makes its money in the quiet stretches and the cluster trades are noise, the cap is free money. If the cluster trades are the good ones, which is common for breakout and trend following logic where the whole point is to be on when everything moves together, the cap is cutting into the part of the distribution you were relying on.
The fix when your best trades are the clustered ones
If the count says your clusters are where the returns live, do not respond by raising the concurrency limit, because that puts the worst week straight back where it was. Respond by lowering the per trade size and raising the count, which holds the worst week constant while letting more of the cluster through.
The same thousand dollar ceiling can be four positions at two hundred and fifty dollars of risk or eight positions at a hundred and twenty five. Both have identical worst weeks. The eight position version participates in almost every cluster your history contains and gives you twice as many samples, which also makes the strategy's own statistics converge faster.
What stops you is friction, and this is where retail accounts differ from everything you read about position sizing. A hundred and twenty five dollars of risk with a five percent stop implies a two thousand five hundred dollar position, which is fine. A hundred and twenty five dollars of risk with a one percent stop implies twelve thousand five hundred, which will not fit eight times into a twenty five thousand dollar account. And on any venue charging a per order commission, halving the size doubles the number of orders and roughly doubles what you pay in fixed costs while your edge per trade stays where it was. Work out the fee number before you commit. On a zero commission equities account or a crypto venue with proportional fees, the eight position version is close to free. Elsewhere it is not, and the four position version with fewer, larger trades is the better answer.
Watch the limit bind before it matters
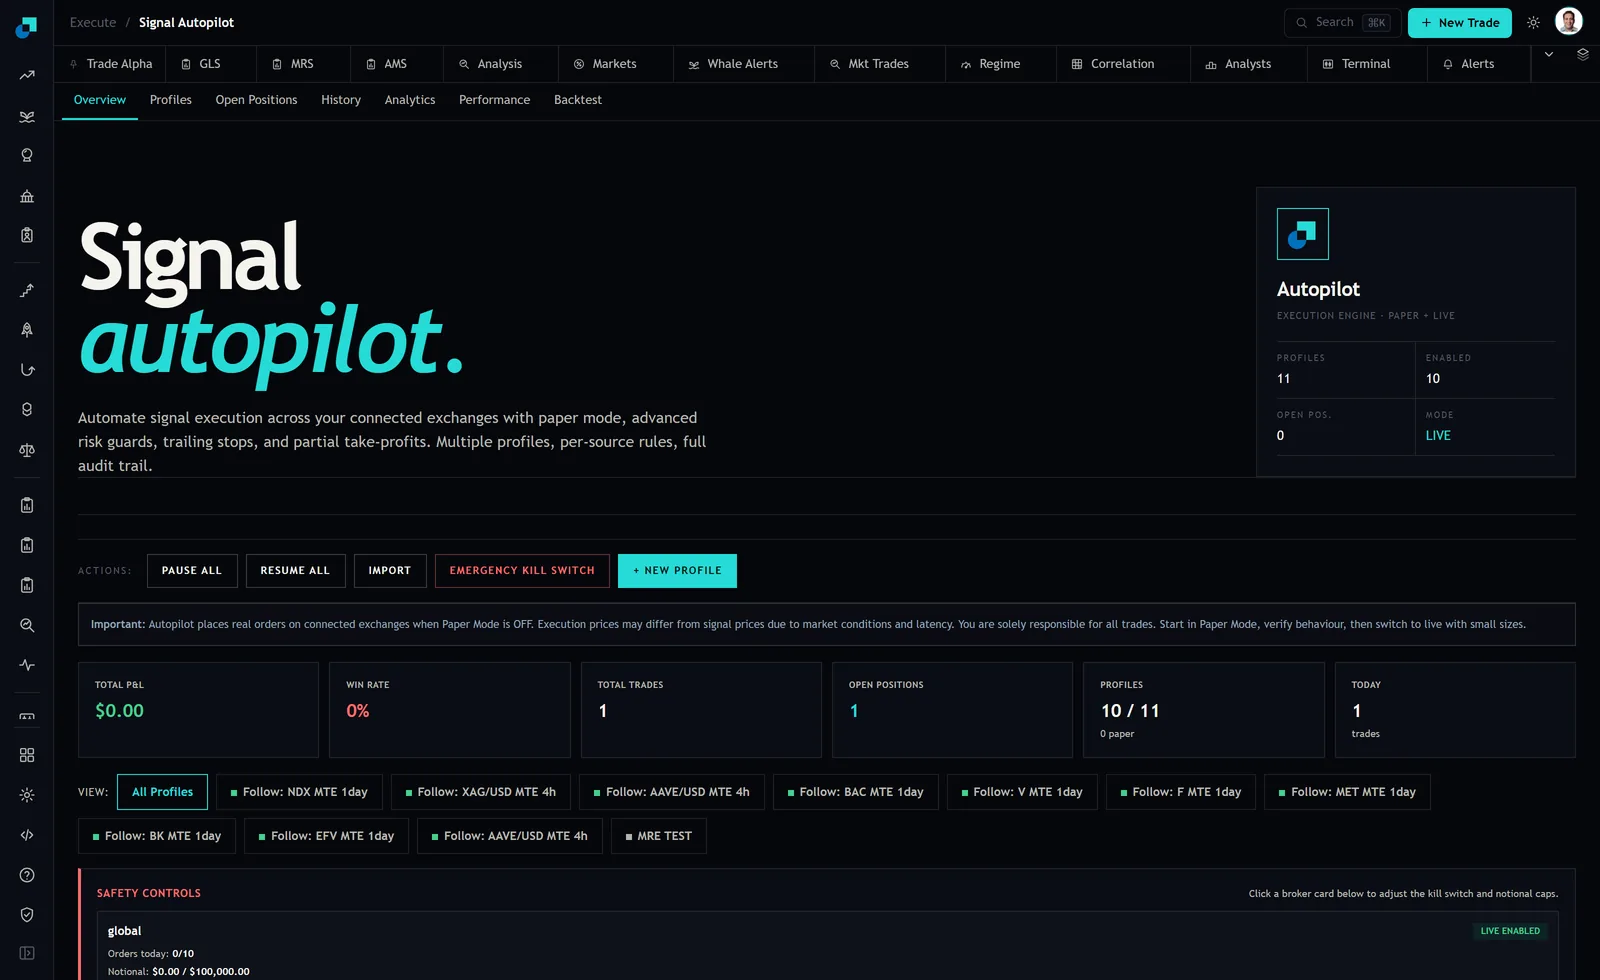
A limit you have never seen take effect is a guess, and the module gives you a way to find out cheaply, since it runs paper alongside live and reports how many of your profiles are in each. My own overview read PROFILES 10 of 11 and 0 paper at the time of writing, which is the configuration where nothing is being tested at all.
Run the profile in paper with the limit you derived and watch two things over a few weeks. The first is whether the cap actually binds. If the Open Positions count never approaches your ceiling, the limit is decorative and your real constraint is the strategy's own selectivity, which is a much less dependable control than a number you set. The second is what happens at the boundary. Find out whether a declined signal is logged, because a skipped entry that leaves no trace is a hole in your record: three months later you will be comparing the profile's realised results against the signal source's published results, the two will not match, and you will have no way to prove that the gap is your concurrency cap rather than the strategy failing.