Almost everybody who finds prediction markets arrives with the same idea. Six venues, all quoting the same events, all with slightly different crowds, so there must be free money sitting between them. Buy Yes cheap on one, buy No cheap on the other, collect the dollar whichever way the world goes. It is a genuinely good idea and it is the reason the cross-venue tooling exists.
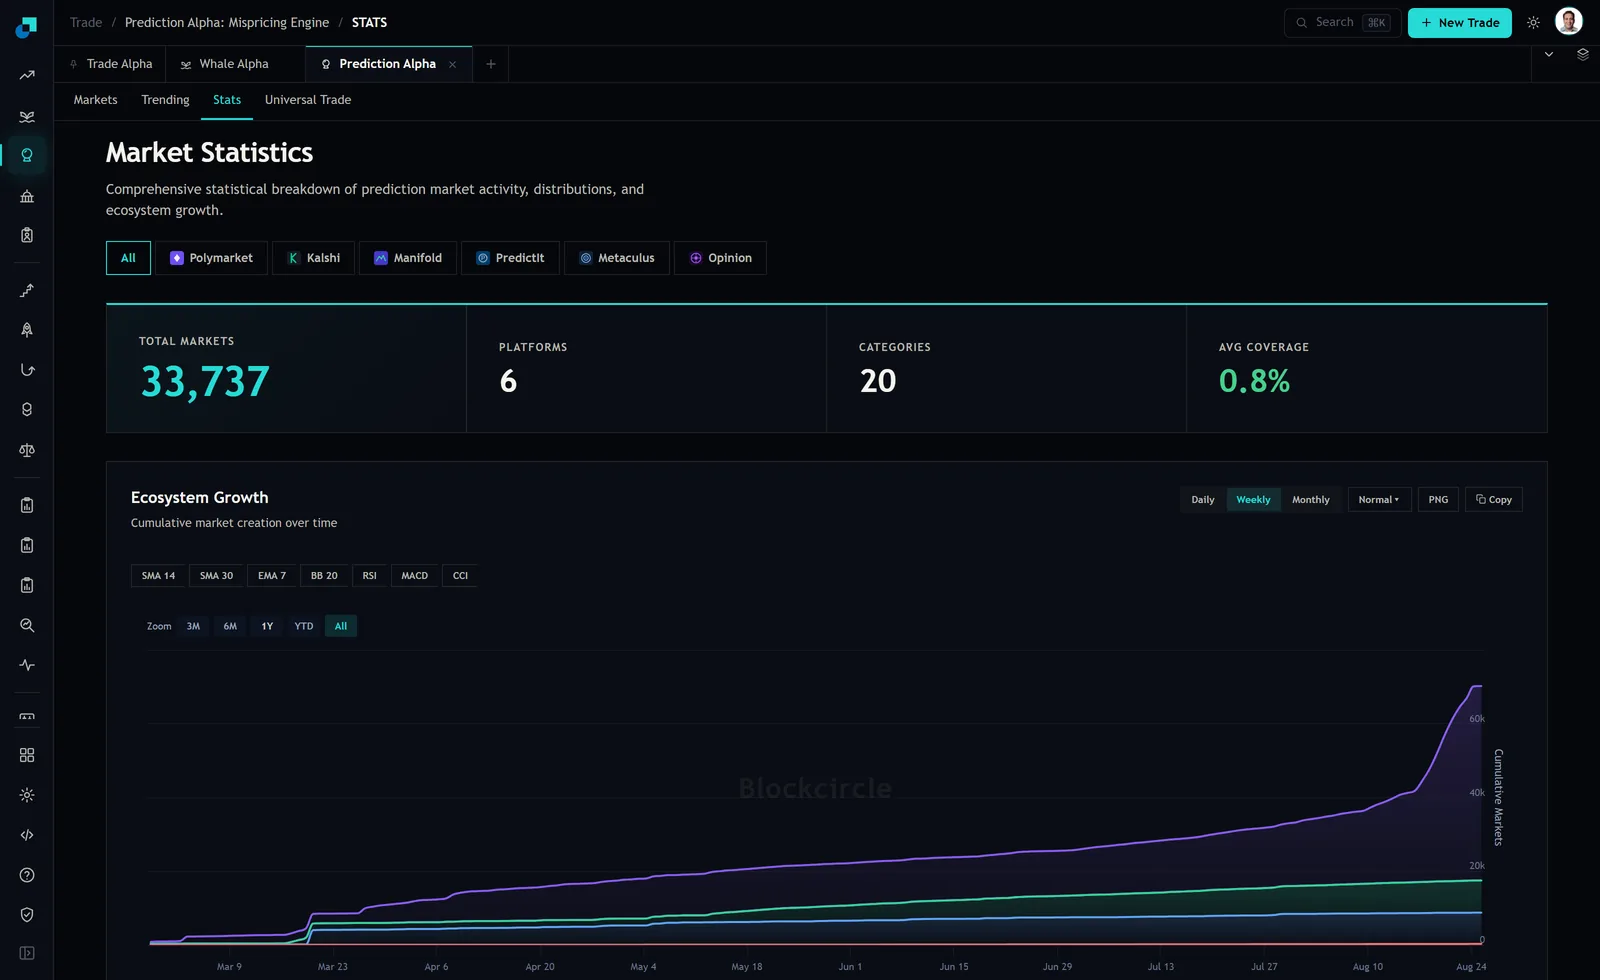
Then you open the stats tab and read the fourth tile. Average coverage, 0.8 percent. That single number is the reason most people who go arb hunting on prediction markets spend a lot of evenings finding nothing, and it is worth understanding properly before you spend one of yours.
Four tiles, and the one that decides your weekend
The Market Statistics page puts four numbers across the top. Total markets 33,737. Platforms 6. Categories 20. Average coverage 0.8 percent. The first three read like scale. The fourth quietly says that the overlap between venues, the thing the whole arb idea rests on, barely exists.
Read that 0.8 percent as the share of indexed markets with a counterpart somewhere else and the arithmetic is quick. Roughly 270 questions out of 33,737 are listed on more than one venue. Not 270 opportunities. 270 candidates, before you have checked a single spread, a single order book or a single set of resolution criteria.
One honest caveat on that reading. The tile is labelled Avg Coverage, and the platform's own language around cross-matching is about mapping two listings to the same underlying outcome with a confidence score. I read the tile as the overlap rate because that is the reading the rest of the module supports, but it is my reading of a label rather than a definition I was handed, and you should sanity check it against the market screen yourself rather than taking it from me.
The arb that has to survive a retail account
Suppose the 270 are real and suppose you find one with a workable gap. You buy Yes at 42 cents on one venue and No at 55 cents on another. Ninety seven cents in, one dollar out, three cents of gross edge on a pair that cannot lose on direction. Now put it through the machinery an individual actually has.
To make one hundred dollars gross you need about 3,300 pairs, which is roughly $3,200 of capital. Not $1,600 on each side of a netted position. Both legs are funded in full at two separate venues with no netting between them, and both stay funded until the contract resolves. On the markets tab there are rows with End Dates running from early September out to 01/01/27. If your pair sits on a four-month contract, that is $3,200 parked across two accounts for four months to earn a hundred dollars before costs.
The costs are not small on that base. Two account funding operations and two withdrawals, at whatever your venues charge, plus any conversion in between. Taker fees on both legs. And the real constraint, which is that you cannot bail out early for a profit. The pair only pays its dollar at resolution, so an exit before then means selling both legs into whatever books exist that day, and the liquidity column on this product runs from $686 on one row to $497.3K on another. On the thin end of that range there is no exit at any price you would accept.
None of this makes the trade bad. It makes it small, slow and operationally heavy, which is a very different proposition from the one in most people's heads. If you are going to do it anyway, do it knowing that the capital is committed to a date the world chooses and not to a date you choose.
The screen already counted them for you
You do not have to take the 0.8 percent on faith, because the markets tab exposes the same scarcity directly. With 1,000 markets displayed after filters, the Cross Match control set to an 80 percent similarity threshold returns 79. The Arb Only filter next to it also shows 79. So on a screen of a thousand of the most active markets on the platform, fewer than eighty have a counterpart the matcher is even willing to pair at that confidence.
Then apply the filters the screen cannot. Some of those 79 are matched to a venue where the money is not real, which removes them as a leg. Some are matched to a forecasting community publishing probabilities rather than a book you can hit. Some are priced so that both legs together cost a dollar or more, which is not a trade. And a chunk of what survives is two questions that only look alike, which is a different article and a real risk. What is left is a handful, and a handful is not a strategy for somebody with a job.
What the other 33,000 markets are for
Here is the redirect, and I think it is the more interesting half. The overlap being tiny does not mean the universe is uninteresting. It means the edge is not in comparing two screens. It is in knowing something about one question that the single price on the single venue does not reflect.
That work looks different. You are not scanning for a numeric gap, you are picking a small number of subjects where you follow the underlying reality closely enough to disagree with a price. The Stats page counts 20 categories. Pick two or three you genuinely track already, not the two that sound most profitable, and ignore the rest completely. A contract on a topic you do not follow is a coin flip with fees attached.
Three practical constraints keep that honest. Check the End Date against how long your view actually holds. A question resolving in four months needs a view that survives four months of news, and most opinions do not. Check the liquidity on the specific row before you decide your size, because the headline turnover on this asset class tells you almost nothing about what is resting on the book. And write down your probability before you look at the quote, because reading the price first quietly turns your independent estimate into an agreement with the market.
The change worth making this week
If you have been running a cross-venue scan in the evenings, stop for a month and see if you miss it. Replace it with two saved views on the categories you actually follow, sorted so the near-dated contracts are visible, and a short list of questions you would be willing to state a number on without looking at the board.
Then check yourself against the list rather than against your P&L. Over ten or twenty resolved questions, were the ones you called at 70 percent right about seven times. That is a slow measurement and it is the only one that tells you whether you have an edge on a single venue. It is also a measurement the 0.8 percent cannot take away from you, because it does not depend on anybody else listing the same question anywhere.