The Insider Alpha performance page states its measurement convention in the first line under the title, and that line decides whether anything below it is usable on a desk. For every past insider filing it tracks the actual forward return at 7d, 30d, 90d and 1yr and compares it to SPY over the same window. The clock starts at the filing. Your clock starts when a child order prints. The distance between those two clocks is the entire subject here.
The panel measures the filing, your book measures the fill
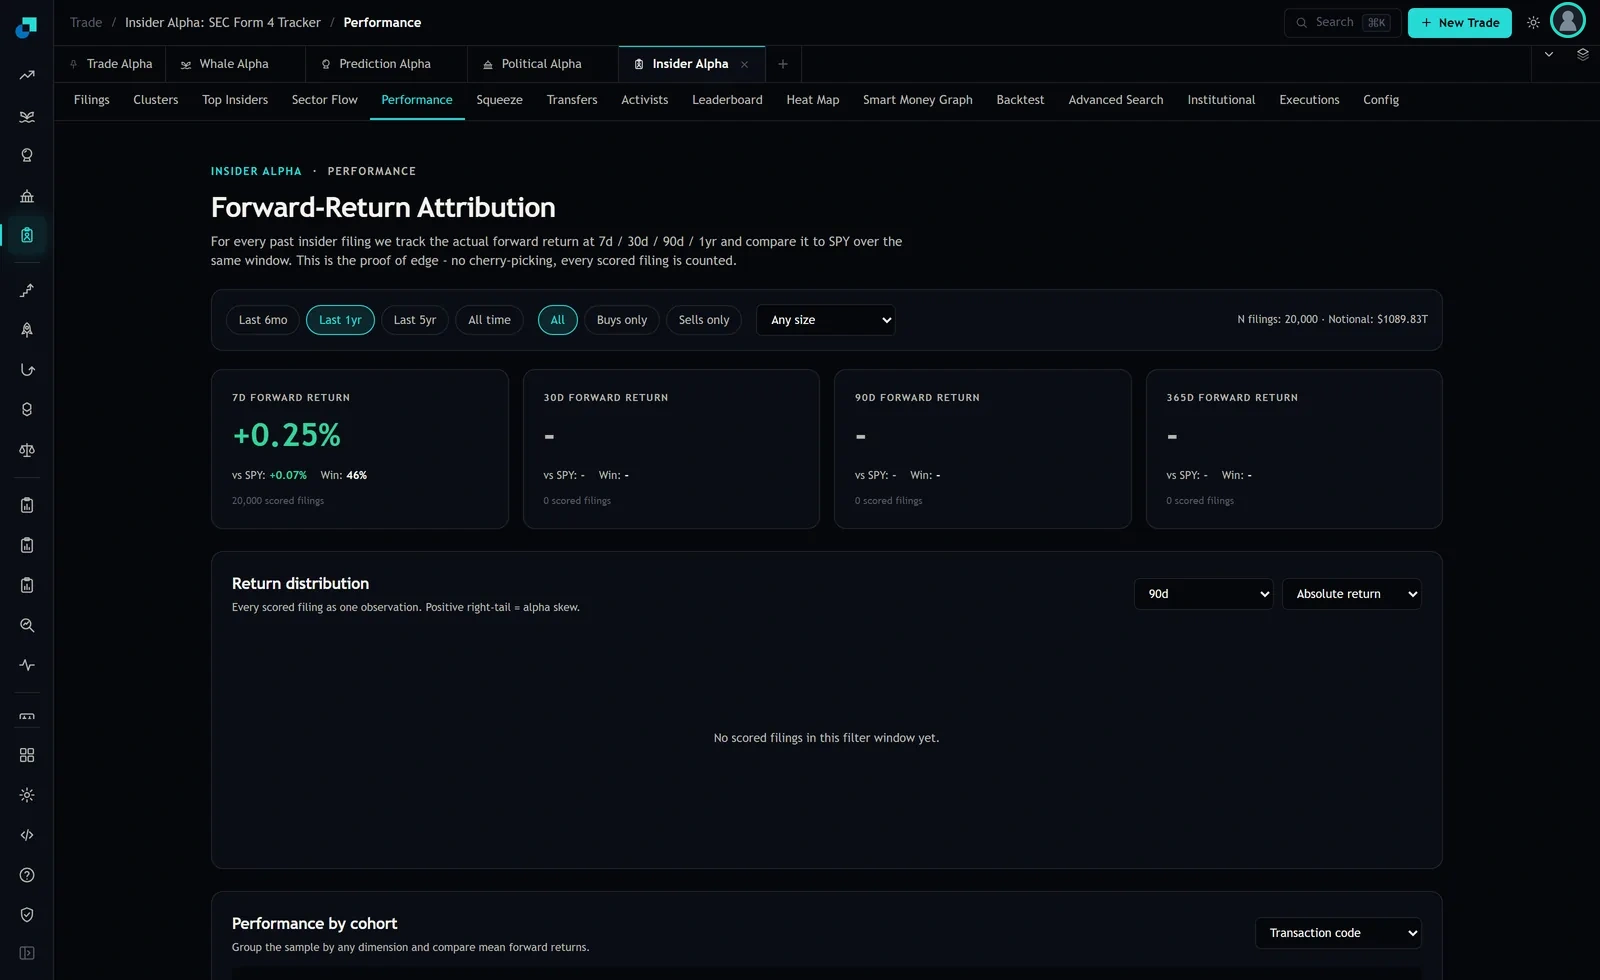
At capture, with the range set to last 1yr and no side or size filter applied, the header strip read N filings of 20,000 and the seven day tile showed plus 0.25 percent against SPY at plus 0.07 percent, a win rate of 46 percent, on 20,000 scored filings. The 30D, 90D and 365D tiles each showed a dash above zero scored filings, so seven days was the only horizon with a population behind it on the day.
Eighteen basis points of gross relative return over seven days. Hold that number, because implementation shortfall in the names insiders tend to file on is quoted in the same units and is routinely larger. When the gross edge and the transaction cost sit in the same order of magnitude, you do not have a strategy until the cost side has been estimated with the care normally reserved for the return side. The cost side is not on this page, and the page does not pretend otherwise.
There is a second consequence of that seven day horizon that matters more than the return itself. A cost is a fixed toll and a holding period is the distance you amortise it over. At seven days you pay the round trip roughly fifty times a year per name slot. At ninety days you pay it four times. The panel could not tell me what the ninety day edge was, so it also could not tell me whether the longer hold that would rescue the cost arithmetic is there to be had.
Four cost lines, attributed separately, or the post mortem argues about the wrong one
Shortfall against a decision price splits into four lines, and the reason to keep them apart is that four different people are accountable for them.
Delay cost is the move between the moment the filing became actionable and the moment your order reached the market. That is research and operations, not the trader. Spread cost is the half spread conceded on each side of the round trip, which is venue and order type. Impact is the price you move by participating, which is the schedule. Opportunity cost is the forward return on the part of the order you never filled, which belongs to whoever set the limit. A single blended slippage number collapses all four into one column and guarantees that the review conversation is about the trader when the loss was usually in the first line or the last.
What the lines cost by liquidity bucket
The table below is a desk assumption set, not a measurement from the platform. Use it as the shape of the problem and replace every cell with your own realised numbers as soon as you have thirty fills to fit them on. The impact allowance assumes a ten percent participation cap and a completion window of three days, which is the aggressive end of what a seven day signal tolerates.
| ADV bucket | Assumed quoted spread | Spread, round trip | Impact allowance, round trip | Total before delay |
|---|---|---|---|---|
| Above 50m USD | 3 bps | 3 bps | 6 bps | 9 bps |
| 10m to 50m USD | 8 bps | 8 bps | 15 bps | 23 bps |
| 2m to 10m USD | 25 bps | 25 bps | 40 bps | 65 bps |
| Below 2m USD | 90 bps | 90 bps | 120 bps | 210 bps |
Set that against eighteen basis points. Only the top bucket clears, and it clears with nine basis points left over before you have paid a single basis point of delay, commission, borrow or financing. The second bucket is already negative. The bottom bucket loses more than ten times the gross edge on the round trip alone, which is not a marginal call requiring better signal selection. It is a category exclusion.
This is the uncomfortable part of the arithmetic, because the names with the highest raw insider signal density are concentrated in the buckets that cannot pay for the trade. That is not a coincidence and it is not fixable by tuning filters. Insider purchases are informationally richest exactly where the informational asymmetry is largest, which is where coverage is thin, which is where the spread is wide. The screen and the cost are produced by the same market feature.
Delay is the line nobody books and the only one you can meaningfully shrink
Spread and impact are structural. Delay is operational, and on a filings strategy it is where the recoverable money sits.
Decompose it honestly. There is dissemination latency between the filing hitting the wire and it appearing in your system. There is scoring and enrichment time before a row becomes a candidate. There is human review, which on most desks is the largest single component and is almost never timed. There is order staging, and then there is the schedule itself, which spreads the arrival price over three days by design and therefore books part of the drift as delay rather than impact depending on where you set the benchmark.
Two decisions follow. First, fix the benchmark before you measure anything, because arrival price and decision price produce different attributions of the same trade and a desk that switches between them can prove whatever it wants. Second, timestamp the human step. If the median gap between candidate and order is four hours on a signal with a seven day half life, you have handed back a measurable fraction of the edge to a review process, and that is a staffing and workflow question with an owner, not a market cost to be absorbed.
One caution on the enrichment side. The panel offers filters for date range, side and trade value at 25 thousand, 100 thousand, 500 thousand and one million dollars, and a cohort panel that groups the sample by dimension, with transaction code as the grouping selector on capture. Those controls describe the population you are studying. They do not describe the liquidity of the names in it, and I could not find an ADV or float control anywhere on the captured screens. The liquidity join is yours to build, and it has to happen before the cost model, not after.
Writing the eligibility rule as a cost budget rather than a liquidity floor
The version of this that survives a committee is not a rule that says avoid illiquid names. It is a budget with an owner and a rerun procedure.
State it as a ratio. Estimated round trip cost must not exceed some fraction of estimated gross edge, and pick the fraction in advance rather than after seeing which names it excludes. A third is defensible and a half is arguable. Anything above a half means you are running the strategy for the broker. With eighteen basis points of gross edge and a one third ceiling, your cost budget is six basis points, which from the table above admits only the top bucket and does so with no headroom for delay. That conclusion is unattractive and it is what the arithmetic says.
Then instrument the escape hatch rather than pretending you will not use it. If the desk wants exposure to the thinner buckets, the honest route is a longer holding period, because the round trip toll is amortised over more days. That route requires a measured edge at thirty or ninety days, and on the day I captured the panel there were zero scored filings at both horizons. So the escape hatch is conditional on evidence the module could not supply at the time, and the correct thing to write in the strategy document is exactly that sentence, with the date of the reading attached.
Finally, log the four lines separately on every fill from day one. Arrival price, decision price, executed price, unfilled quantity and the forward return on that unfilled quantity. When a position is reviewed, the question is never whether the insider was right. It is which of the four lines consumed the edge, and you can only answer that in a meeting if you were recording it before the meeting was scheduled.