A percentage attached to a trading signal does something to the brain that no other number does. Forty percent reads as a forty percent chance of making money, and from there it is a short step to sizing the position as though that were a fact. It almost never is a fact, and before getting to why, there is a more basic thing to establish.
Check which screen you read the number on. This matters more than the number.
The reversal feed and the regime screen are different products
The Market Reversal Engine setup feed shows nine fields per row. Ticker, Price, TF, Signal, Side, Type, Read, Time, and an Action control. In the capture I am working from, there is no confidence column on that table, and no per-row percentage anywhere in the setup list. What you get instead is a state, OVERBOUGHT or OVERSOLD, a side, a class, a timeframe, and a sentence in the Read column.
A confidence percentage does exist elsewhere on the platform. The Market Regime Detector, which is a separate screen, prints one against its regime classification. That number is describing how strongly a set of scorecards agree about the overall market environment. It is not attached to a trade, it has no entry price and no stop, and carrying it across to a reversal row would be reading one instrument's dial on another instrument's dashboard.
So if you came here holding a forty percent figure, the first job is to find out what it was measuring. If it was a regime classification, it is a statement about conditions. If it came from a scoring rule you or somebody else built on top of the feed, then everything below applies and the rule is yours to interrogate.
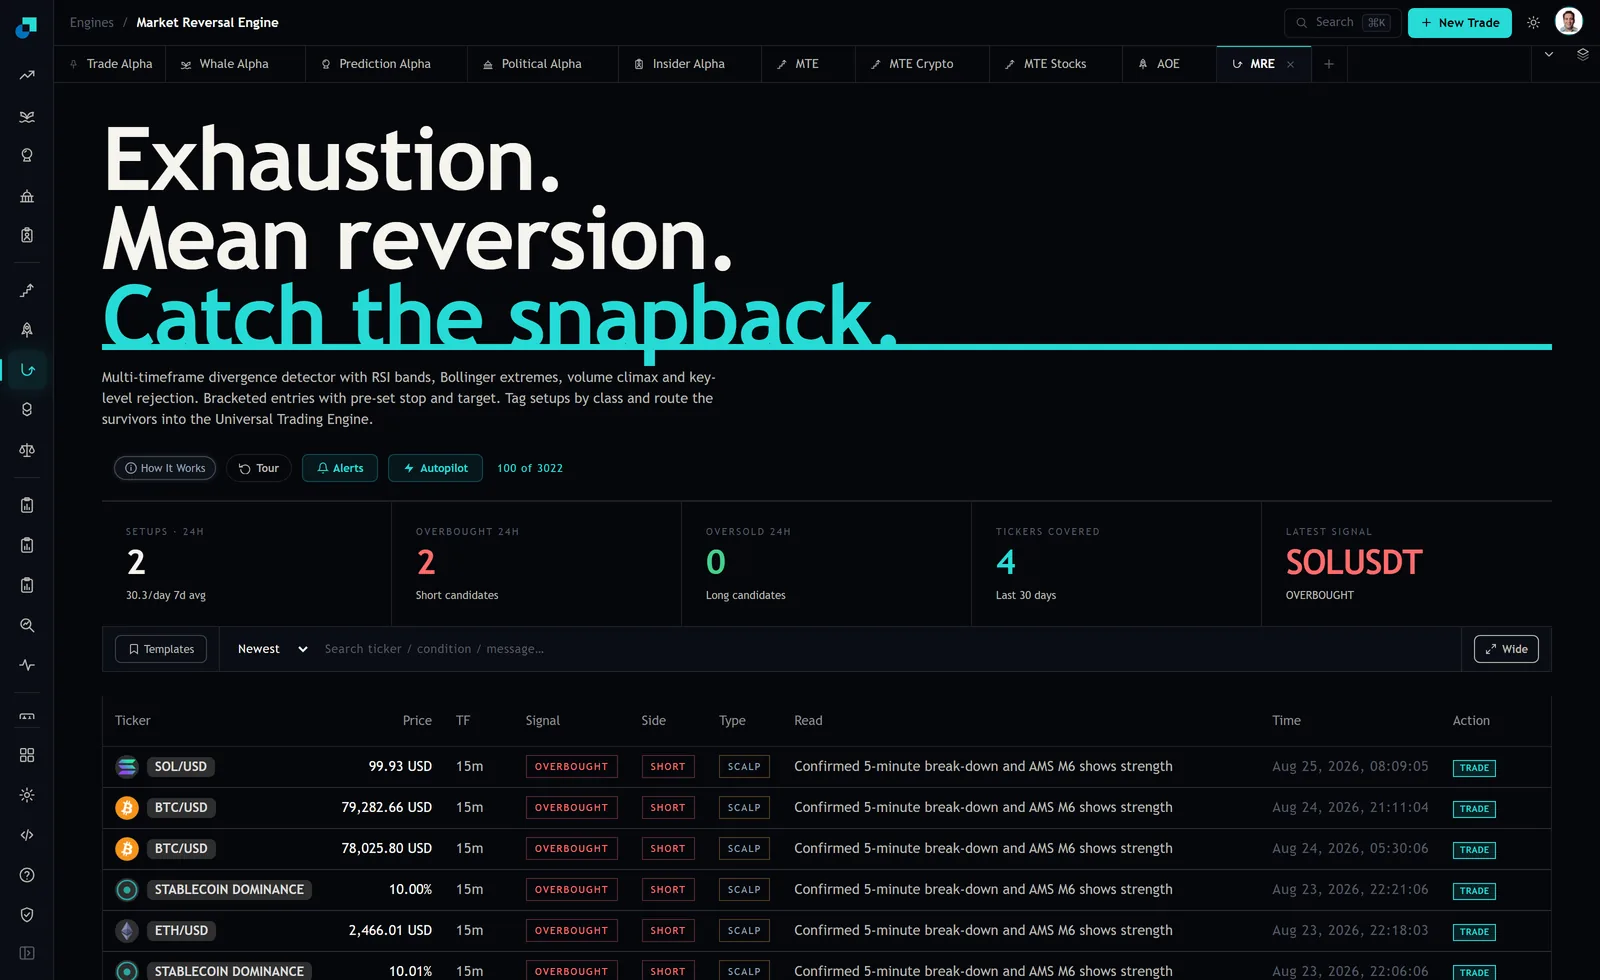
That absence is not a shortcoming. A number that looks like a probability and is not one causes more bad sizing decisions than no number at all, and a feed that hands you the underlying conditions instead is asking you to do a small amount of work that is genuinely yours to do.
What a confluence score counts, when there is one
Whenever you do meet a confidence figure on a signal, in any product, the first question is what is inside it. In the overwhelming majority of cases the answer is agreement, not probability.
The construction is usually some version of this. Several components each vote. The votes are weighted and normalised onto a nought to one hundred scale. Forty percent means a minority of components agreed, or the strong ones did not. That is real information and it is a completely different quantity from the historical frequency with which such setups made money.
The distinction has teeth. A probability of profit has to be calibrated against outcomes, which means somebody went back and checked that things labelled forty percent happened about forty percent of the time. An agreement score never needs to touch outcomes at all to be computed. Two numbers on the same scale, one of which has been tested against reality and one of which has not, and the display gives you no way to tell them apart.
The tell is usually in the extremes. Agreement scores cluster and rarely sit near zero or one hundred, because it is unusual for every component to disagree with every other. Calibrated probabilities do reach their extremes. If you have never seen a score below thirty on a system, you are looking at an agreement measure.
The test that settles it in twenty rows
If you have a score, calibrate it yourself. It takes a notebook and about three weeks.
Log every signal your rule scores, in two buckets. Above your cutoff and below it. Record the outcome under the bracket as it shipped, target or stop, without improvising exits, because an improvised exit turns the test into a test of your improvisation.
Then compare the two buckets on hit rate. Not on profit, on hit rate, because profit mixes in position size and you are trying to isolate whether the score discriminates. If the high bucket and the low bucket land in the same neighbourhood, the score is not telling you anything about outcomes, whatever it is telling you about agreement. That is a useful finding and it costs you nothing but the discipline of writing rows down.
Twenty in each bucket is not a study and it will not settle a marginal case. It will settle a big one, and big is the case you actually care about, because a score that discriminates weakly is not worth building a rule around anyway.
Building the agreement count the feed does give you
Without a printed score, you can assemble a rough agreement count from the row and the feed around it. Four things are visible and each is one vote.
- The Read string. It conjoins conditions, and in the capture every visible row reads as a confirmed 5-minute break-down with AMS showing strength. Two named conditions is more agreement than one. Read the sentence rather than skimming past it.
- Repetition on the same instrument. Two BTC rows appear in the capture at 21:11 and 05:30 on consecutive days. Repeated signals in one direction on one instrument are a stronger statement than an isolated row, though they are also one situation rather than two independent ones.
- The breadth tiles. Overbought in 24 hours read 2 and oversold read 0 at capture. A row pointing the same way as a lopsided day has the tape agreeing with it.
- Whether the row survives the two price-action checks you make yourself, which are a visible volume climax and a level you drew before today.
Count them. Four out of four is a setup worth normal size. Two out of four is the honest equivalent of a forty percent reading, and the correct response to it is a smaller position or none, not the same position with more hope attached.
The cutoff a small account should use is a cost cutoff
Here is the part that actually decides it for a retail-sized account, and it has nothing to do with the score.
Every visible row in the feed is a SCALP on a 15m timeframe. Scalp-class trades have small targets by construction, and small targets mean costs are a large fraction of the outcome. Work your own numbers. Take your venue's round-trip cost, fees plus the spread you actually pay, as a percentage. Take the distance from entry to the target on a typical row of this class, also as a percentage. Divide.
If costs eat a fifth of the target, a marginal setup has to be substantially better than a coin flip before it is worth putting on. If costs eat a third, marginal setups are simply not available to you at that size, and no confidence figure changes that arithmetic. This is the reason a small account should pass on low-agreement scalps, and it is a far more solid reason than any threshold on a score.
The number to write down this week is that ratio for your own account and your own venue. It tells you which classes of setup you can afford to be uncertain about, and for most retail-sized scalping the answer is none of them, which is worth knowing before the next two-out-of-four row appears at half past five in the morning.