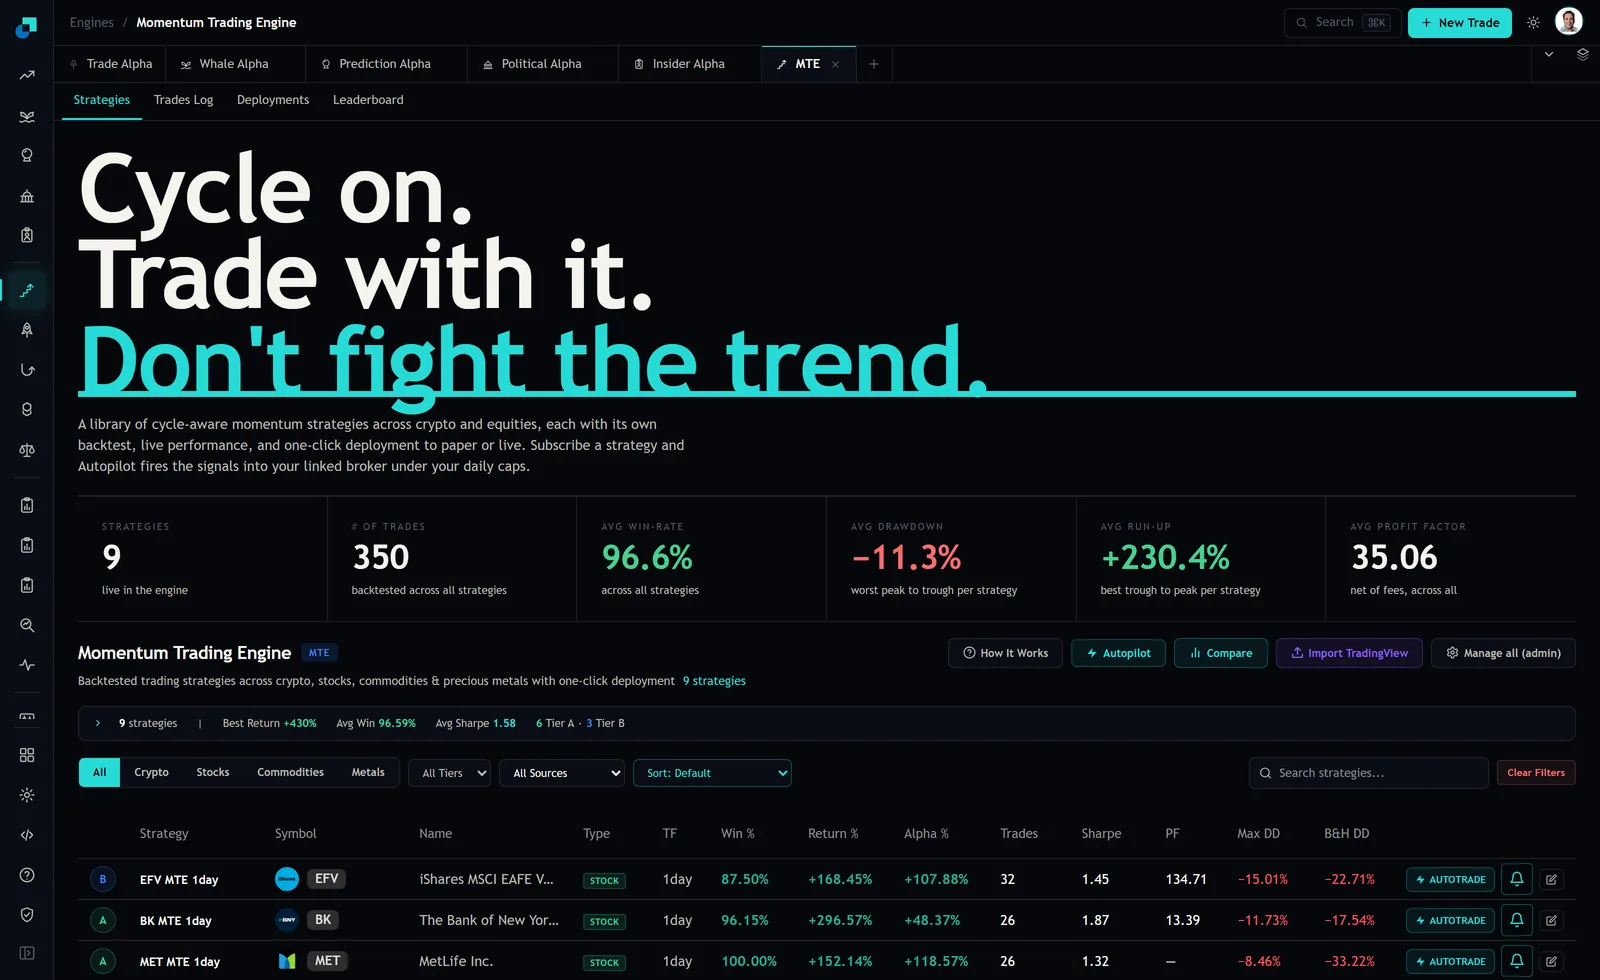
Drawdown is the number that decides whether you are still running a strategy in month seven, so it is worth more attention than it usually gets. The Momentum Trading Engine reports it two ways, and reading either one alone will mislead you. The header strip carries an average drawdown across the whole engine, which at capture read minus 11.3 percent and was labelled as the worst peak to trough per strategy. Individual configurations carry their own figure in their notes, and those run wider than the average suggests.
The number that actually answers your question is not on the row by itself. It is the pair. What did the strategy lose at its worst, and what would you have lost over the same window holding the symbol it trades. One of those numbers alone is a fact. Both together are a decision.
Why a lone drawdown figure is uninterpretable
Take the configurations the engine publishes notes for. A swing configuration on a Solana perpetual is described with a 15 percent drawdown. One on a Curve pair carries 16 percent. Two configurations on the same equity ticker, running on 60 minute and 30 minute bars, carry 17 percent and 20 percent. Ranked on drawdown alone, the Solana configuration looks like the safest of the four.
That ranking is worthless without the second number. A 15 percent worst drawdown on a perpetual that fell 70 percent at some point in the window is a strategy that got you out of the way of something serious. A 15 percent worst drawdown on an instrument that never fell more than 18 percent is a strategy that sat through nearly the whole decline and saved you three points for your trouble. Same figure, opposite verdicts, and the row does not tell you which one you are looking at.
The comparison you have to build yourself
The buy and hold side of the comparison is the easy half and almost nobody does it. Pull up the symbol on the same timeframe over the same window and find its worst peak to trough. That is a five minute job with a chart. Write it down next to the strategy figure, and now you have the ratio that matters.
Work an example. Strategy drawdown of 15 percent against a buy and hold drawdown of 62 percent gives a ratio of about 0.24, meaning the rules exposed you to roughly a quarter of the pain of holding. Strategy drawdown of 20 percent against a buy and hold drawdown of 26 percent gives 0.77, which is close enough to one that you are essentially holding with extra steps and extra fees. Anything above about 0.8 should make you ask what the exit logic is doing at all.
The engine's own configuration notes give you a shortcut on the return side of this. They quote outperformance of buy and hold as a multiple, 19 times on one crypto configuration and 5 times on another, 4 times and 5 times on the two equity ones. That multiple is a return statement, not a risk statement. A strategy can beat buy and hold by 19 times on return while taking most of the same drawdown, and if it does, the return multiple came from leverage or compounding rather than from avoiding declines.
The denominators that quietly change the meaning
Three things need to be equal before a drawdown comparison is honest, and they usually are not.
- Time in market. A strategy that is flat 60 percent of the time is compared against a symbol that is invested 100 percent of the time. That is not a like for like risk comparison, it is a comparison of two different exposures. The engine's trade log carries a Duration column and an Active or Closed status, so you can add up holding time and find out what your real exposure was.
- Leverage. One published configuration runs at leverage 2 and another at leverage 0. A drawdown figure computed on a levered position and one computed unlevered are different units. Doubling the leverage roughly doubles the drawdown, so a 15 percent figure at 2x is a 7.5 percent figure at 1x, and comparing it against an unlevered buy and hold without saying so overstates the strategy's risk control.
- Bar frequency. Drawdown measured on daily closes is smaller than the same drawdown measured intraday, because the worst tick inside the day never appears in the series. Two configurations on the same ticker at 60 minute and 30 minute bars are not measuring on the same ruler.
What a drawdown figure does not survive
The worst peak to trough in a backtest is a single observation. It is the one worst thing that happened, and single observations are the least stable statistic you can build. With 350 backtested trades spread across nine strategies, roughly 39 trades each, the worst drawdown in a strategy's history is one event out of thirty-nine. Run the same rules through a different year and that number moves a lot.
The practical consequence is that you should treat the published drawdown as a floor rather than a ceiling. It is the worst thing that happened in the sample, which is not the worst thing that can happen. A reasonable working assumption for sizing is that your live worst drawdown will be somewhere between one and two times the backtested one. If a strategy shows 20 percent and you would abandon it at 25 percent, you do not have room to run it.
The other thing the figure does not survive is the run-up tile sitting next to it. Average run-up of plus 230.4 percent is described as the best trough to peak per strategy, which means it is an unrealised high water mark on an open position, not money that was ever banked. If you read minus 11.3 percent and plus 230.4 percent as a risk and reward pair, you have compared a real loss against a paper gain and concluded the trade is twenty to one in your favour. It is not, and that pairing is the single most common misreading of this header.
Sizing off the pair rather than the row
Here is the pass that turns this into a position size. Take the strategy drawdown and double it, because the sample worst is not the real worst. Decide the largest peak to trough hit you will actually sit through in dollars, which for most people is a much smaller number than they say out loud. Divide the second by the first and you have your position size.
A strategy showing 20 percent, doubled to 40 percent, against a 1,200 dollar loss you are honestly willing to sit through, gives a 3,000 dollar position. That will feel too small next to a row advertising a return multiple of 5 times buy and hold. It is the size that keeps you in the seat on the day the drawdown arrives, which is the only day the sizing decision ever gets tested. And if that size makes the strategy not worth running after commissions, then the drawdown pair has just told you something true about the strategy that no return column was going to tell you.