Steep downside skew reliably produces the same sentence in a market note, which is that the options market is pricing a crash. It is a bad sentence and it survives because it sounds like a forecast, which is what people want from a screen. What skew is actually measuring is closer to an inventory position. It is the price at which a constrained set of dealers is willing to warehouse a specific risk that a large, persistent, one-directional group of buyers wants to be rid of. That is a statement about who owns what, not about what the market believes will happen.
The distinction matters because the two readings imply opposite trades. If steep skew is a forecast, you defer to it. If it is positioning, you are looking at a supply and demand imbalance in an insurance market, and the correct question becomes whether you are paid enough to be on the supply side. Getting that backwards is how a desk ends up short the exact convexity its book needs.
Skew is the price of a warehousing service
Under a lognormal model the smile is flat. It is not flat in any market anyone actually trades, and the standard explanation given to junior people, that returns have fat left tails, is true but insufficient. Fat tails alone would produce a smile. What produces persistent one-sided steepness is that the buyers of downside protection are structurally price-insensitive relative to the sellers.
A pension fund, an allocator with a drawdown mandate, a lender against collateral, a treasury with a covenant: none of these are optimising for the fair value of a put. They are buying a constraint. On the other side sits a dealer who must hedge the position dynamically, in a market where the hedge gets harder and more expensive precisely in the scenario the option pays out. The premium the dealer charges for that is a funding and capacity charge. It moves with dealer balance sheet, with recent realised gap risk, and with how much of the same exposure they already carry. None of those inputs is a view on the underlying.
The ratio on the screen is not the reading
The first number people reach for is the put/call ratio, and on its own it is close to useless.
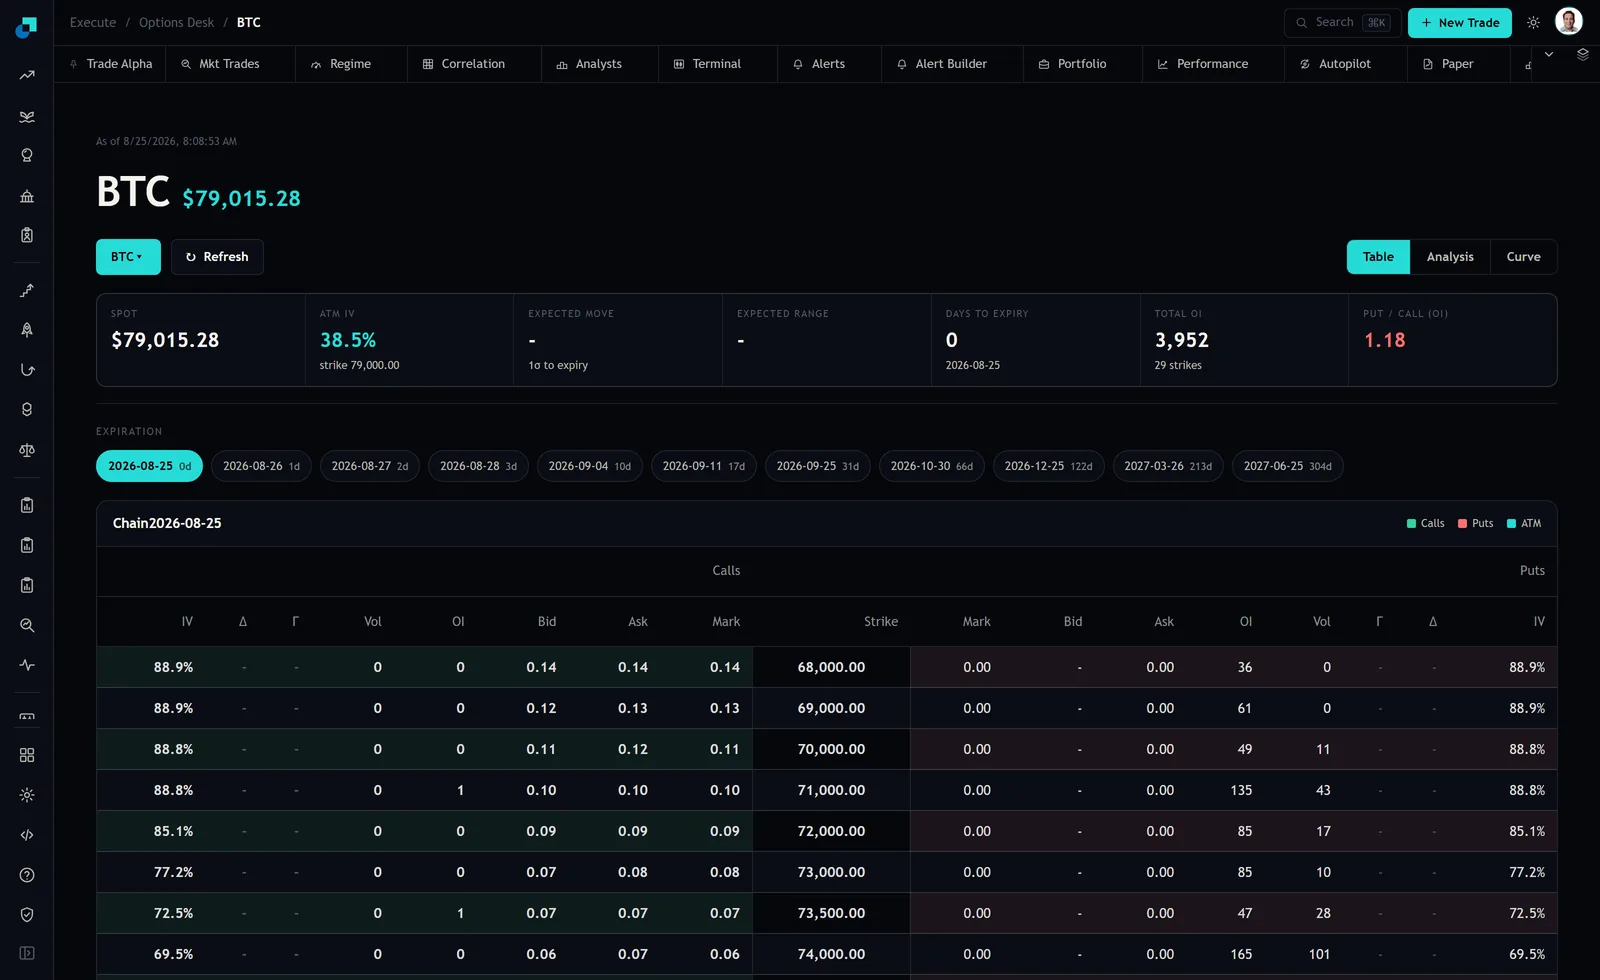
That is the BTC chain read on 25 August 2026, spot 79,015.28, at-the-money implied volatility 38.5 percent against the 79,000 strike, put/call on open interest at 1.18. A ratio above one tells you there are more puts outstanding than calls, which is the ordinary resting state of most chains that serve hedgers, because downside buyers are a standing constituency and there is no equal and opposite group with a structural need to own upside. Comparing 1.18 against 1.00 is comparing it against a level that was never neutral. Comparing 1.18 against where the same chain has sat over the past few months is a reading. Comparing it against what the ratio was before the last drawdown is a better one.
Four checks that separate positioning from fear
When the wings look expensive relative to the at-the-money, these are the follow-ups I want before anyone acts on the observation.
- Is at-the-money vol moving with the wings, or standing still? Skew steepening while ATM vol is flat or falling is the signature of a hedging flow: someone is buying a specific strike, not buying volatility. Skew steepening while ATM vol rises is a broader repricing and deserves more respect as a forecast.
- Is open interest at the steep strikes growing, or just turning over? Volume without a corresponding rise in open interest is existing protection being rolled or closed. Volume that adds open interest is new demand entering. The first is calendar maintenance and tells you little; the second is a genuine change in who is exposed.
- Is the steepness in one expiry or across the curve? Confined to a single tenor, it usually points at a dated catalyst inside that window. Present at every tenor from the front week out to the 304-day expiry on this ladder, it is structural, and structural steepness is a standing charge rather than a signal that just appeared.
- Does realised behaviour support it? If the underlying has been gapping downward and grinding upward, the implied skew is describing something the tape is genuinely doing. If realised returns have been roughly symmetric while implied skew has steepened, the gap between the two is the positioning component, and it is the part you might get paid for.
None of these four is decisive alone. Together they usually resolve the question, and just as importantly they leave a written record of why you concluded what you concluded, which is what a reviewer will ask for later.
Being paid to supply protection, and the way it goes wrong
Suppose the checks come back on the positioning side. The obvious expressions are selling the rich downside outright, selling a put spread, or financing long upside by selling the put in a risk reversal. Each of these is a decision to be short the instrument that pays out in the scenario that also damages the rest of your book, and that correlation is the whole risk, not a footnote to it.
A naked short put obliges you to buy the underlying at the strike regardless of where it trades, so the loss runs all the way to zero on the underlying and can far exceed the premium received. A put spread caps that, and in exchange it caps your income at a level that often does not compensate for the tail you have kept, because the strikes people choose tend to leave the sold leg close and the bought leg far. A risk reversal is the most dangerous of the three in practice, because it looks costless on the ticket and it is not: you have converted a premium outlay into a short downside position with an unbounded profile and the ticket shows a credit.
Then there is the failure specific to this analysis. You can be entirely correct that the skew was positioning rather than forecast and still lose badly, because positioning becomes the forecast when it unwinds. If the crowded holders of protection are forced to monetise, or the dealers who sold it are forced to hedge into a falling market, the flow itself moves the price. The judgement that a level is not predictive says nothing about whether it can become self-fulfilling under stress. Size accordingly, and never size a short-convexity position on the assumption that you will be able to reduce it, because the liquidity that lets you out is the first thing that leaves.
How to write it up so it survives a drawdown review
The reason to be careful with the language here is that the note you publish becomes the document you are held to. A note that says the market is pricing a crash has committed you to a forecast, and if the crash does not arrive you look like you were wrong about the world. A note that says downside protection is bid at a level consistent with hedging demand rather than a repricing of the distribution has committed you to something narrower and checkable.
What I want on the page is the observation, the four checks with their answers, the level of the skew measure against its own history, the size of any position taken as a fraction of the open interest at those strikes, and the specific condition that would change the conclusion. Then, separately and explicitly, the scenario loss: what the position costs if the underlying gaps through the sold strike before you can adjust, computed at the wider spreads that will actually be quoted that day rather than the ones on the screen now. A desk that has that paragraph in the file before the event is a desk having a very different conversation afterwards than one that has a screenshot of a steep smile and a sentence about the market pricing a crash.