A feed row gives you one entry price per position. A wallet that built that position across two hundred transactions over eleven hours on three venues did not have one entry price, it had a distribution, and the single number standing in for it is a summary whose error you cannot see from the row.
That matters the moment anyone tries to use the number for something. Sizing a replication, measuring how far a copy fill sat from the reference, judging whether a position is in profit, or writing down how much cushion the reference participant has before they are forced to act. All of those depend on the weighted cost, and the weighted cost is not on the screen.
The column that tells you a single entry cannot be right
The Whale Finder grid carries a column headed AVG / MED / MAX $, and it is the most underused thing on the page. It reports, per wallet, the average trade size, the median trade size and the largest single trade. The relationship between the first two is a direct read on how concentrated the wallet's dollars are in a small number of tickets.
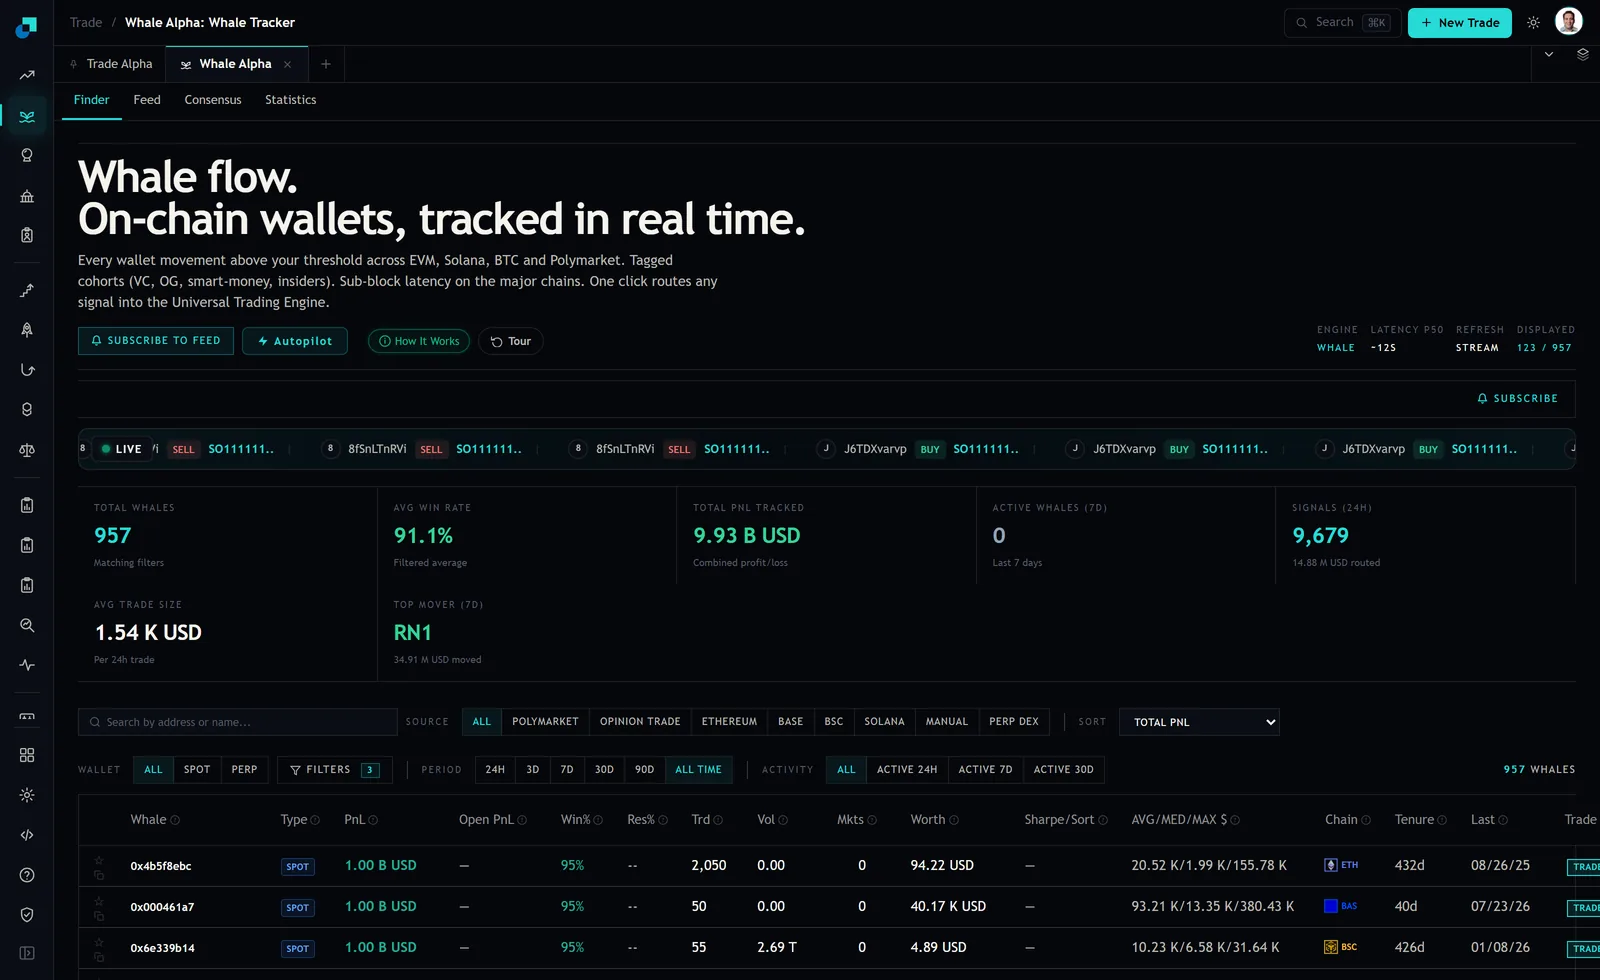
Work the ratio for the three rows on the capture and they separate cleanly. The first, on Ethereum, runs a mean of 20.52K against a median of 1.99K, a ratio of 10.3, over 2,050 trades. The second, on Base, runs 93.21K against 13.35K, a ratio of 7.0, over 50 trades. The third, on BSC, runs 10.23K against 6.58K, a ratio of 1.6, over 55 trades.
The third wallet trades in a consistent size. The first two do not, and the first one badly does not. For a replication programme those are three different instruments, and the ratio is computable from a column that is already rendered, before you touch a single transaction record.
Defining which fills belong to the position
Reconstruction is a weighted mean, which is trivial arithmetic sitting behind a hard definitional problem. You need to decide which fills constitute the position, and that decision is not given to you by the data.
Write a rule and apply it identically to every wallet, because the rule is the only thing that makes wallets comparable to each other. A workable one has four parts. An instrument and direction match. A time window with a stated maximum span. A stop condition, so that a fill in the opposite direction closes the accumulation window rather than being netted into it. And a minimum fill size, below which you exclude, with the threshold recorded, because dust and rebalancing transfers will otherwise pollute the median.
The window length is the parameter that does the most damage if you leave it to taste. Too short and you cut off the tail of an accumulation and overstate how tightly the whale entered. Too long and you merge two separate campaigns into one artificially wide average. Pick it, justify it once against the wallet population you are studying, and then leave it alone. Changing it per wallet to make results look tidier is how a reconstruction stops being evidence.
How far the naive figure sits from the weighted one
Take a wallet that buys 2,000 units at 100, then adds 200 units at 130 as the position moves in its favour. The naive last-fill entry says 130. The unweighted average of the two fill prices says 115. The true volume weighted entry is 2,000 times 100 plus 200 times 130, all over 2,200, which is 226,000 over 2,200, or 102.7.
The unweighted average overstates the cost by more than twelve points on a position whose real basis is 102.7. Reverse the order, so 200 units at 100 followed by 2,000 at 130, and the weighted entry is 280,000 over 2,200, or 127.3, while the unweighted average is still 115 and now understates by twelve.
The error runs in both directions, its size scales with exactly the mean to median skew the Finder column reports, and its sign depends on whether the size clustered at the start or the end of the accumulation. That last point is the one with trading content: a whale whose large clips came early has a cheap basis and a lot of room, and a whale whose large clips came late is sitting near its own cost and is much more likely to be forced out by a modest reversal. Those two are indistinguishable from a single entry number and obvious from a reconstruction.
Venue, unit and the entity boundary
Three practical constraints, all visible on the same capture.
Venue first. The three rows carry Chain labels of ETH, Base and BSC. The same nominal asset on three chains is three order books with three prices at the same instant, and a weighted average across them is only meaningful once you have stated a price source per venue and a convention for bridging or FX. Say which, in the note, or the number is not reproducible.
Unit second. The grid mixes spot rows with perpetual rows through its Type column, and a weighted entry on a perp has to account for funding accrued over the accumulation window if you intend to compare it to a spot basis. Otherwise you are comparing a gross number to a net one.
Entity third, and this is the constraint that ends most reconstructions. The Finder does not carry a key that ties a wallet on one chain to the same participant's wallet on another. Three rows on three chains are three wallets. If a participant accumulates on Base and hedges on BSC, no row in this grid holds the position, and any reconstruction that treats one row as the participant's book is answering a smaller question than the one asked. Supplying that linkage is your work, it is evidential rather than mechanical, and the note should carry the evidence class it rests on.
Use the grid for shape, not for reconciliation
One warning about treating this table as a source of truth for values rather than shape. On the capture, three separate wallets on three separate chains all displayed a PnL of exactly 1.00 B USD and a win rate of exactly 95%. A figure that several unrelated wallets share to the penny is a ceiling in the display rather than a measurement. Alongside it, the Vol column read 0.00 for two of the three rows, and one row showed a Worth of 94.22 USD next to that same billion dollar PnL.
Those cells cannot all be right, and the correct inference is not to pick the plausible one. It is to reconstruct from underlying transaction records and use the grid only for the properties it reports consistently and structurally, which are trade count, size distribution, chain, tenure and last activity date. Those four are enough to select which wallets are worth the reconstruction effort, and selection is what a screening grid is for.
What the reconstruction has to carry to be reusable
The output is not a number, it is a number with its construction attached. Record the wallet address and chain, the accumulation rule with all four parameters, the window boundaries actually used, the fill set with a count and a total, the price source per venue, the funding treatment, the resulting weighted entry, and an error band derived from the sensitivity of the result to the window length rather than asserted.
Then record the two things a reader will want and will not otherwise get: where the large clips fell within the window, and the mean to median ratio of the fills you included. The first tells them how much cushion the participant has. The second tells them how much to trust the single number you just handed them, which is the whole reason the reconstruction was necessary in the first place.